International Data Center: Customize Your Information
210 likes | 304 Views
Customize your data by selecting indicators at country or regional level, generate tables, maps, and download data in Excel or PDF formats. Explore various categories for comprehensive information.

International Data Center: Customize Your Information
E N D
Presentation Transcript
Customize Your InformationUsing the New International Data Center January 2011
Click here to begin customizing your data
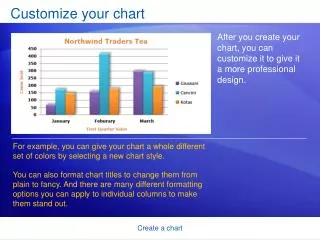
Click here to customize your own table
Click on one of these categories to select the type of indicator you will use to create your table
If you opt for regional indicators, select up to 10 from any section, then click Create Table to generate your results
Click here to download the data into Excel, or to create a PDF printer-friendly version
If you opt for country-level indicators, select up to 10 from any section to generate a table, then click Next to continue
Click here to choose all countries… Then click here to continue …Or choose only a few countries to compare
Click here to download the data into Excel, or to create a PDF printer-friendly version
Click here to map a specific indicator in multiple countries
Please download Adobe flash player if the map does not appear on the screen
Clicking on the left button of your mouse, draw a square around the region you want to zoom in
Drag the cursor over the map to get the specific data available for each country
Click on a specific country to get the data available for the indicator that was chosen
Click here to go back to the full map A pop- up window will appear, with the data for that specific country
Click here to download the data into Excel
Click here for all available data on a specific country Choose your country using the drop-down menu or by clicking on the map
Click here to download the data into Excel, or to create a PDF Expand each category for more information and additional resources Scroll down to get a list of the most recent resources available for this country in our Web site