Download
1 / 7
70 likes | 219 Views
Test for Independence. Average. Superior. Total. Low. 112. Male. 22. 81. 9. 108. Female. 14. 75. 19. Total. 220. 36. 156. 28.

E N D
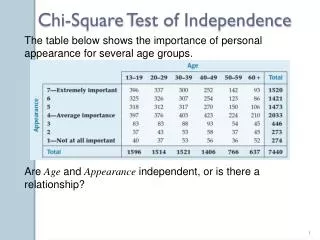
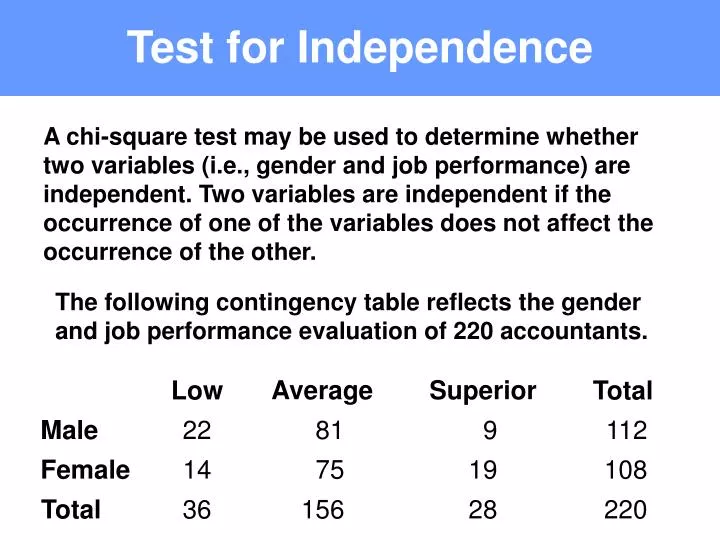
Test for Independence Average Superior Total Low 112 Male 22 81 9 108 Female 14 75 19 Total 220 36 156 28 A chi-square test may be used to determine whether two variables (i.e., gender and job performance) are independent. Two variables are independent if the occurrence of one of the variables does not affect the occurrence of the other. The following contingency table reflects the gender and job performance evaluation of 220 accountants.
Expected Values Total Average Superior Low 112 Male 18.33 79.42 14.25 108 Female 17.67 76.58 13.75 Assuming the variables are independent, then the expected value of each cell is: E1,1 = (112)(36)/220 = 18.33 E1,2 = (112)(156)/220 = 79.42 All other expected values can be found by subtracting from the total of the row or the column. Total 220 36 156 28
Sampling Distribution The sampling distribution is a distribution with degrees of freedom equal to: (Number of rows – 1) (Number of columns – 1) Example: Find the sampling distribution for a test of independence that has a contingency table of 4 rows and 3 columns. The sampling distribution is a distribution with ( 4 – 1) (3 – 1) = 3•2 = 6 d.f.
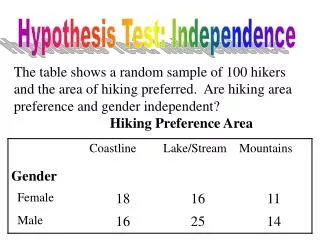
Application Average Superior Total Low 112 Male 22 81 9 108 Female 14 75 19 Total 220 36 156 28 The following table reflects the gender and job performance evaluation of 220 accountants. Test the claim that gender and job performance are independent. Use . 1. Write the null and alternative hypothesis. H0: Gender and job performance are independent. Ha: Gender and job performance are not independent. 2. State the level of significance.
3. Determine the sampling distribution. Since there are 2 rows and 3 columns, the sampling distribution is a chi-square distribution with (2 – 1)•(3 – 1) = 2 d.f. 4. Find the critical value. 5. Find the rejection region. 0 5.99 6. Find the test statistic.
Chi-Square Test 22 18.33 13.49 0.74 81 79.42 2.50 0.03 9 14.25 27.61 1.94 13.49 0.76 14 17.67 2.50 0.03 75 76.58 19 13.75 27.61 2.01 220 220.00 5.51 O E (O – E)2 (O – E)2/E = 5.51
5.99 0 7. Make your decision. The test statistic, 5.51, does not fall in the rejection region, so fail to reject H0. 8. Interpret your decision. Gender and job evaluation are independent variables. Do not hire accountants based on their gender, since gender does not influence job performance levels.