Download
1 / 36
380 likes | 519 Views
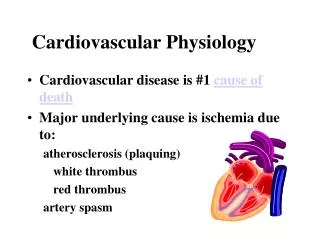
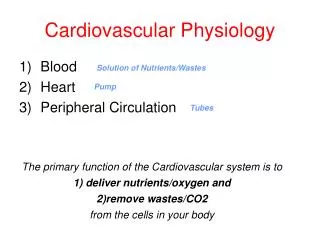
Comprehensive guide on the electrophysiology of the heart, covering autorythmic cardiac action potentials, phases of depolarization and repolarization, EKG wave interpretation, heart block types, and cardiac dynamics factors. Learn about Starling's Law, sarcomere length, preload and afterload effects, and mechanisms of contractility regulation. Discover the intricate relationship between electrical and pump coupling in the heart. Explore essential concepts in cardiovascular physiology and mechanisms for controlling arterial pressure.

E N D
Electrophysiology of the Heart • Action Potentials • Conduction Pathways • EKG’s
Autorhythmic Cardiac AP • Phase 4 Depolarization • only SA, AV, His/P • I(f) - “Funny” current, now thought to be inward Na+ • Phase 0 Depolarization • due to Ca++ influx • (L-type) • Officially, no phase 1 or 2 • Phase 3 Repolarization • Due to K+ permeability 0 3 4
Myocardial Action Potential • 0 – Na+ influx (voltage-gated) • 1 – Na+ inactivation and K+ (IK) outward • 2 – slow inward Ca2+ • 3 – Ca2+ inactivation and K+ outward (IK1) ARP RRP
EKG Waves and Intervals QRS length R T P Q S Normal: PR interval: 0.12-0.2 sec QRS length: <0.10 sec QT interval: 0.3-0.4 sec Abnormalities in: QRS – ventricular depolarizaton problems P-R interval – A/V conduction problems P-R interval Q-T interval
EKG Reading 0.2 sec 0.04 sec 1.0 mV Test pulse HR = 1500/ small boxes between QRS complexes
EKG Axis Determination Late Ventricular Depolarization Atrial Depolarization Septal Depolarization Apical Depolarization Repolarization Lead I:
Determining Mean Electrical Axis • Use 2 different leads • Measure the sum of the height and the negative depth of the QRS complex • Measure that vaule in mm onto the axis of the lead and draw perpendicular lines • The intersection is at the angle of the mean axis.
Abnormalities • Rate: • Sinus bradycardia: <60 BPM at rest • Sinus tachycardia: >100 BPM at rest • A/V Heart Block: • 1st degree: P/R interval > 0.2 sec (slow AV node) • 2nd degree (Mobitz): • Type 1 (Wenckebach): slowly increasing PR interval until dropped QRS complex • Type 2: Sudden dropped QRS • 3rd degree (complete): no correlation between P and QRS waves
1st Degree AV Block- increased P-R interval 2nd Degree (Wenckebach)- increased P-R, then no QRS 2nd Degree (Mobitz II)- Isometric P-R, then no QRS 3rd Degree Preceded by Ventricular Escape no block
Caridac Pump Dynamics • Cardiac Cycle • Pressure • Flow • Resistance • Elastance/Compliance
Starling’s Law of the Heart • The heart adjusts its pumping rate to the rate of blood return. How? • More blood returning stretches the atria and ventricles more. • Stretching heart SA node muscle causes faster rhythmicity. • Stretching heart muscle causes faster conduction. • Stretching heart muscle causes stronger, more complete contraction.
Length Tension Relationship Operating Range Tension % Max Active Tension Resting Tension 100 50 1.5 2.2 3.0 Sarcomere Length mm
Preload and Afterload • Preload: Wall tension at EDV (analogous to EDV or EDP • As Preload increases, so does Stroke Volume. This is a regulatory mechanism. • Factors that increase venous return, or preload: • the muscular pump (muscular action during exercise compresses veins and returns blood to the heart), an increased venous tone, and increased total blood volume. • Afterload: A sum of all forces opposing ventricular ejection. Roughly measured as Aortic Pressure. • As Afterload increases, stroke volume decreases.
Contractility • Increased by increasing myocardial Ca++ • Means greater shortening of fibers at a given fiber length. • Increased contractility = Increased CO (SV) • Positive Inotropy: • Increased HR (more Ca++ in the cell) • using b1 agonists or cardiac glycosides (digoxin) Inhibit Na/K ATPase Decrease Ca export Increases inward Ca Causes PLB phosphorylation Activates SERCA
Mechanisms of increased contractility= regulation of [Ca++] • The more crossbridges between actin and myosin are present, the higher the contractility. • PK-A phosphorylates the Ca channels through which Ca leaves the SR and enters the myoplasm from the T-tubules.. This causes a greater amount of Ca flux through the channels and a greater net calcium influx into the cell. • As sarcomeres shorten, they become less responsive to an increase in Ca++. So, positive inotropic effects work best on a heart that is working under stress. PK-A More Ca++ avail. for later.
LV pressure/volume loops Normal Positive Inotropy When does the aortic valve open? When is the 2nd heart sound? Increased Afterload
Electrical-Pump Coupling Diagram e d c • Atrial contraction causes increased atrial and ventricular pressure. • Mitral valve closes (1st heart sound), isovolumetric contraction begins. • Aortic valve opens, aortic pressure equals LV pressure. • Systolic pressure • Aortic valve closes (second heart sound), isovolumetric relaxation begins • Mitral valve opens b f a
Pulse Pressure Pulse Pressure = SP-DP
Normal Pressures • Right Atrium (Vena Cava)- 5 (systolic)/3 (diastolic) mmHg • Left Atrium (Pulmonary veins) 10/8 • Right Ventricle – 28/3 • Left Ventricle –125/8 • Aorta- 120/70
Controlling Arterial Pressure • Increasing TPR, SV, or HR increases Mean Art. Pressure. • Increasing Arterial compliance reduces MAP. • Baroreceptors • Aortic Arch, Carotid Body – sense drastic changes in blood pressure, send impulse through CN IX and X to depressor centers and cardiac inhibitory centers • Peripheral chemoreceptors • Also in aorta and carotid - pO2 detectors increase blood pressure in times of low pO2
Central Chemoreceptors pO2 pCO2 H+ Central Chemoreceptors Sympathetic Outflow Contractility, VR, Respiration, Blood Pressure, etc
Important Formulas - CO=HR x SV = VR in most pts. - Tension =(Pressure inside the chamber x radius) (2 x wall thickness) More generally, T ~ P x R - Mean Art. P. = (1/3 Pulse P.) + Diast. P - Stroke Volume=EDV-ESV - Ejection Fraction= SV/EDV. Normal EF is 0.5-0.75 - Starling: J(mL/min) =K[(Pc-Pi)-(pc-pi)] - Fick’s :CO = O2 Uptake / ([Arterial O2] - [Venous O2])
Resistance • Parallel • Most vascular beds • Lower total Resistance • Independent control • Series • Sequential pressure drops • Portal circulations(Hepatic, Hypothalamic Hypophyseal, etc)
Vasoactive Substances • Local • Metabolites (adenosine, K+, CO2) • Neurotransmitters (a1- constriction, b2-dilation) • Hormones (Histamine, Bradykinin) • General • Renin-Angiotensin-Aldosterone System – conserves water and salt, constricts arterioles • ADH (Vasopressin) – vasoconstrictor and water conservation • ANP (Atrial Natriuretic Peptide) – arteriolar dilator and increased salt/water excretion
Hyperemia • Active Hyperemia: increased blood flow to meet metabolic demands • Exercising muscle • Active neurons • Reactive Hyperemia: Increased blood flow occurring after a period of inadequate blood flow • Heart after contraction • Transient Ischemic Attack
Special Circulations • Coronary: Mainly metabolic control. • vessels narrow during systole due to mechanical compression • Cerebral: Mainly metabolic. • Muscle: Metabolic and sympathetic during exercise, both symp and some para fibers • muscular activity moves venous blood back to heart • Skin: Sympathetic, Temperature regulated • Cold- vasoconstriction of arterioles, AV shunts take over • Warmth- vasodilation of arterioles • Fetal: Anatomical Shunts • Ductus Arteriosus, Foramen Ovale, Ductus Venosus
Congestive Heart Failure • Left Ventricle can’t pump blood properly • Causes: • HTN, CAD, Alcohol, others • Lead to dilation of the chamber and thinning of the ventricular walls • Law of LaPlace- a dilated heart needs more tension to generate a given pressure • Symptoms: Pulmonary Congestion (edema), dyspnea, orthopnea
Acute Blood Loss/Hemorrhagic Shock Blood Loss Decreased Ven. Return CO, MAP Decrease Compensation Decompensation Cardiac Hypoperfusion/Failure Decreased CO due to LV ischemia Acidosis Due to lactate buildup Further depresses CO CNS Depression Medullary blood flow decrease leads to inhibition of CV centers Clotting Dysfunctions Pro-coag during early shock Anti-coag during late shock Baroreceptor reflexes arteriolar vasoconstriction Chemoreceptor reflexes due to hypoxia Cerebral ischemic response causes further symp. response Increased capillary fluid reabsorption tissue fluid is re-absorbed Endogenous vasoconstrictors Epi, Ang II, Vasopressin RAAS Dec. renal perfusion activates renin, increases ang II, aldo