Download
1 / 35
350 likes | 596 Views
Impact of trade agreements on the agricultural sector. Elaine Alexander Chairperson: Agri SA Commercial Policy Committee. Content. About Agri SA Some economic realities in SA agriculture Producer Support Estimates (PSE) SA Agricultural trade Trade Agreements

E N D
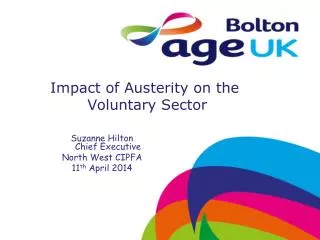
Impact of trade agreements on the agricultural sector Elaine Alexander Chairperson: Agri SA Commercial Policy Committee
Content • About Agri SA • Some economic realities in SA agriculture • Producer Support Estimates (PSE) • SA Agricultural trade • Trade Agreements • Costs and Trade Factors Impacting Agricultural Value Chains
Agri SA • Agri South Africa is a federal organisation which promotes, on behalf of its members, the sustainability, profitability and stability of commercial agricultural through its involvement and input on national and international level • Represent commercial and emerging farmers through: • 9 provincial unions • 24 commodity organisations
Number of farming units Source: Stats SA, 2007
The cost squeeze for SA farmers, 2008 to 2012 (2005 = base year = 1) Source: DAFF
Agriculture’s linkages with the rest of the economy • Backward linkages • Purchases of goods such as fertilizers, chemicals and implements • Forward linkages • Supply of raw materials to industry and the food supply chain in general • Approximately 70 percent of agricultural output is used as intermediary products in other sectors
Agriculture’s linkages with the rest of the economy • GDP multiplier for agriculture is 1.51. (Mullins ,2004) • Increase of one rand in agric production will result in an R 1.51 increase in the GDP of the country. • On par with the GDP multiplier for the total average economy of 1.58. • Labour multiplier of 24.17 outweighs all other sectors (Mullins, 2004) • Well above the same multiplier for the economy as a whole of 8.16.
Minimum Wages versus employment in agriculture, forestry and fisheries (2003-2013)
The Producer Support Estimate (PSE)is an indicator of the annual monetary value of gross transfers from consumers and taxpayers to support agricultural producers, measured at farm gate level, arising from policy measures, regardless of their nature, objectives or impacts on farm production or income.
Producer Support Estimates as % of gross farm receipts, 2009-11 average OECD Members Emerging Economies Producer Support Estimates, 2012
Estimates of support to agriculture (PSE) in selected non-OECD and OECD countries (2011) Source: OECD, Agricultural Policy Monitoring and Evaluation, 2012 * 2010 Info
Producer Support Estimate by commodity, South Africa, OECD Source: OECD
South African Agricultural exports and imports, 1990-2012 Source: DAFF
EXPORT AND IMPORT VALUE OF AGRICULTURAL PRODUCTS (F.O.B) (R’million) Source: DAFF
Regional composition of South Africa’s export basket in 2012
Contribution by Agriculture to total South African trade, 1990-2011 Increase after deregulation and liberalisation Agricultural trade slower than overall trade
Various trade agreements • In place • SACU • AGOA • SADC/EU Economic Partnership Agreement (EPA) • EU TDCA • EFTA • Envisaged • SA-India • SADC-COMESA-EAC Tripartite FTA • BRICS
AGOA • TheUnitedStatesimported: • $285 million (2012) worth of SouthAfricanagriculturalproducts; • wine, macadamia nuts, citrusfruitandotherconsumer-orientedfoodproducts • SouthAfrica’simports of agriculturalproductsfromtheUnitedStates (2012): • $287 million - intermediate goods for further processing locally and consumer-oriented food products. • Aiming to increase trade with Southern Africa • The US Department of Agriculturereportsthat 2012 US exportstoSouthAfrica of drypeas, lentilsandchickpeas rose to 9,340 MT, a massiveincrease of 170% over 2011.
EPA negotiations between the SADC EPA Group and the EU • SA requested improved access to the EU on 21 agricultural products, of which the EU made an offer on 17 products • The EU for its part also requested reciprocal access to the SACU market in a number of product groups. • At the level of SACU, we have made progress in meeting the EU demands, and this is likely to be closely linked to one of the major outstanding areas in the negotiations, a specific agricultural safeguard clause. • SADC EPA Group’s request for a special agricultural pre-dates the surge in poultry imports for the EU. • Other areas which potentially affect the agro-food sector: • Rules of origin • Tripartite FTA and all-Africa FTA • Export taxes • The most favoured nation (MFN) clause.
Costs and Trade Factors Impacting Agricultural Value Chains ELAINE ALEXANDER
Increasing Regionalisation of Trade Food Security –access & nutrition Sustainability Changing Consumption Patterns Trans National Retail Corruption Global Economic Crisis Shift in Economic Power New Political Alliances Global Political Unrest Global Terrorism Tradability of Agri ! Failure of DOHA! Inputs, Labour Energy, Regulation, Ports, Compliance, Freight, Credit Exchange Research ? Trade Factors
Container VALUE CHAIN Inspection Packhouse / Transport Coldstore Vineyard Inland Depot Export port /Coldstore Container Transport Coldstore Loading Ship Import port Discharge Consumer Supermarket Transport Depot
Trade factors • Tariffs & Non Tariff Measures, infrastructure, finance, exchange rates, power factors of chain stakeholders (private standards) • PROTECTIONISM - Complexity Rules – RED Tape • Barriers to trade 2007-08 47 new trade restrictions 2009 – 66 trade restrictions - 47 trade restricting measures. • Employment - EU EPA, Indonesia licensing • Consumer – Sanitary barriers (Chemicals usage) non science – EU • Phyto sanitary access processes – lengthy - China, non science - Japan
Protectionism • Russia - EU Pig ban (cattle and sheep virus?) • Russia – MRL Residues 0.03% ? • Indonesia – Port of Jakarta closure • China – Irish Pork Ban, Belgium Chocolate Ban? • Thailand – SA Deciduous Fruit Ban! • Subsidies – US $ 100m grant to Agriculture 2012 • Export subsidies – EU,US, Japan, South Korea • Developed nations subsidise ! • Developing restrict !
Trade/Market Access: Processes & Structures SA/EU PIP Priorities Dept. of Trade & Industry Dept. of Agric Traceability Issues (EU 178/ SA GAP) Grading Stds W groups SPS food safety work group Directorate: Plant Health, Quality and Food Safety **SPS & Market Access Working Group Directorate: Int. Trade & Business Dev. Sub work groups SPS MRL work group NAMC **Industry Working Groups *Agric. Trade Forum SA PIP Steering Comm. Commercial Agric. Industry Phytosanitary work group Provinces Industry MRL work groups (x2) *WTO/Free Trade agreements/Policy, etc. **Phytosanitary/Food Safety/MRL/Traceability/ SPS/TBT Policy Issues/PRA’s Research Framework / Strategy
More stringent SPS Rules? • EU – Ethephon MRL reduced 2010 • Reduced MRLs for pesticides • lost 30 to 40 actives etc. • USA – FCM issues - irradiation • Brazil – ban on certain fertilizer etc. usage 2011 • Indonesia – health certificate, closure of Port • Vietnam/ Cambodia / Kazakhstan – Pest Risk Analysis required 2011 • Russia – Food safety • China – Special steri markets – HK E Alexander
Regional Fresh Produce SPS Notifications: 01/01/12 – 30/09/12 GLOBAL TOTAL = 950 Food Safety = 26.6% Plant Health = 14.8% TOTAL = 60 F/S = 33.3% P/H = 3.3% TOTAL = 40 F/S = 10% P/H = 12.5% TOTAL = 124 F/S = 18.5% P/H = 4% TOTAL = 316 F/S = 44.3% P/H = 6% TOTAL = 25 F/S = 20% P/H = 4% TOTAL = 47 F/S = 14.9% P/H = 17% TOTAL = 271 F/S = 15.5% P/H = 32.5% TOTAL = 55 F/S = 20% P/H = 20% TOTAL = 12 F/S = 8.3% P/H = 16.7% ELAINE ALEXANDER
What can be done? • Take the lead • Invest in building NTM capacity - • Integrated communication and response systems • Sound Domestic institutions – policy etc. • IPAP 2 Quality and Safety Standards (Food Control Body) • Use available support mechanisms to develop best practice production and market systems (Green box and Amber box support) • Build partnerships – pvt. and public e.g. Australia HAL, Chile – Prochile • Develop expert capacity • Multilateral tool box – WTO, FTA’s, CODEX FVO
Thank you Elaine Alexander – elaine@satgi.co.za Dawie Maree – dawie@agrisa.co.za