Download
1 / 26
260 likes | 352 Views
Fitness (exp. lifetime repro of genotype) is ultimate measure of performance. Approx.:. Often approx by short-term indices of performance that are. expected to be correlated with fitness, like. Microeconomics of max. some currency by optimizing tradeoffs:

E N D
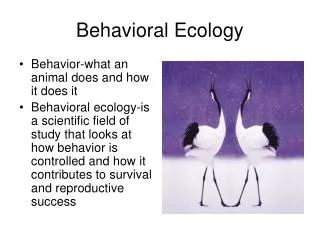
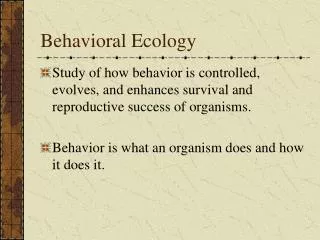
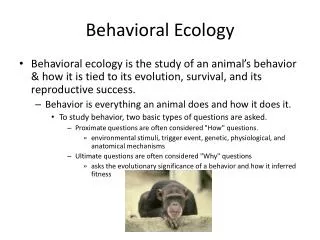
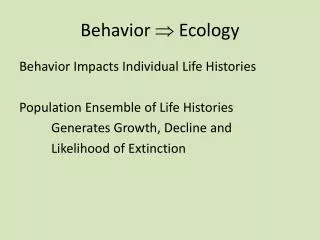
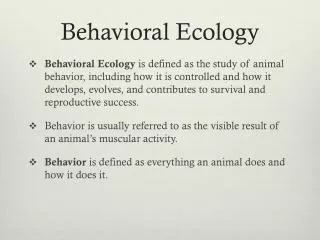
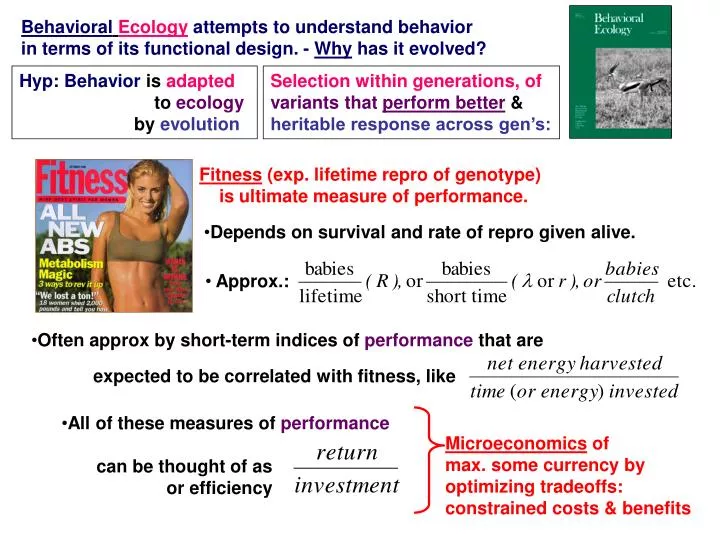
Fitness (exp. lifetime repro of genotype) is ultimate measure of performance. • Approx.: • Often approx by short-term indices of performance that are expected to be correlated with fitness, like Microeconomics of max. some currency by optimizing tradeoffs: constrained costs & benefits • All of these measures of performance • can be thought of as • or efficiency BehavioralEcologyattempts to understand behavior in terms of its functional design. - Why has it evolved? Hyp: Behavior is adapted to ecology by evolution Selection within generations, of variants that perform better & heritable response across gen’s: • Depends on survival and rate of repro given alive.
Suppose the fitness effects of I and A are additive, such that: If there is an optimal x* that maximizes fitness w, then at x* : “marginal value” of a little more I “marginal value” of a little more A A simple optimal decision – control problem Suppose there are two things you can choose to do: this I or that A Your continuous decision (control) variable is: x = how much time you allocate to this I. You have a constraint : your total time available is T, so if you allocate x to this I you can only allocate y(x) = T-x to that A {this is a tradeoff constraint} This is a troubling problem because both I & A contribute to your fitness w and you do so want to maximize your fitness!
and the rates of return for I & A constant, such that: Then: which can only = 0 if a=c, unlikely! “marginal rate” at x* long-term ave rate given x* A simple optimal decision – control problem Suppose the fitness effects of I and A are additive, such that: This is why linear systems tend to “max out” at the extremes w/o interior optima, & why “diminishing returns” (nonlinear systems) are so important in decision theory
Optimal diet algorithm for discrete food types says same thing: keep adding types of decreasing profitability (e/t) until next lower type is less profitable than ave rate of return from diet of search and harvest only better types. Many animals become more or less choosy as best food becomes more or less abundant - qualitatively correct. • Always find partial preferences • imperfect knowledge • lag while learn • variation in prey & predators In the optimal load size problem, Marginal Value Theorem says: add units (of time & load) of diminishing value until next lower unit would be lower than ave rate of return from just better units. Predict foragers: more choosy when good types more abundant, less choosy when good types less abundant. Does the Optimal Diet Algorithm help us understand the behavior of real animals? Sort of! But, the model assumes perfect knowledge, and predicts discrete thresholds (no partial preferences)
Hyp: max. a simple currency: • Loading curve, • cumulative harvest in patch • diminishing returns: • prey depletion • prey evasion • load interferes What load size maximizes possible tp time in patch tt travel time to & from patch of prey Too long Too short Central place foraging in starlings - while feeding babies in nest: • Postulate parents efficient - in some sense • Predict decision variable = load size • giventravel time&loading curve constraints. Marginal Value Theorem: At opt, slope of loading curve (marginal value) equals long term average rate of return (per trip)
if lower harvest rate • stay longer, smaller load • if longer travel time tt • stay longer, bigger load tt tp Does Marginal Value Theorem help us understand central place foraging - load size in starlings? Sort of! Kacelnik exp’s: vary distance from nests to artificial patches & vary loading curves by dribbling out mealworms at different, diminishing rates Predict: Observe: predictions qualitatively correct, but not quantitatively correct More recent work indicates that starlings don’t measuretime or amount on accurate, objective scale.
Reject poor (2: pennies) if good (1: quarters) are abundant: t s1 < 24 value poor type<exp value of search Benefit of pursuing poor type exp. value of search, opportunity cost of pursuing poor type In the optimal load size problem, Marginal Value Theorem says: add units (of time & load) of diminishing value until next lower unit would be lower than ave rate of return from just better units. Optimal diet algorithm for discrete food types says same thing: keep adding types of decreasing profitability (e/t) until next lower type is less profitable than ave rate of return from diet of search and harvest only better types. The math boils down to this: given an opportunity to pursue a low quality option (2: pick up penny), should it be rejected becausesearch for better options (search for 1: quarters) expected to be more profitable in long run? Reject poor type (2: penny) if: Predict foragers: more choosy when good types more abundant, less choosy when good types less abundant
Adjust choosiness to max. expected return? be more selective: In richer environ, Optimum ave value acceptable item Valuevalueitems time item h time = x Acceptable items time less choosy more choosy reject poor and worse accept better and best Foraging theory: Hyp: animals have evolved under selection to be economical-efficient foragers. else waste time handling else waste time searching
Recent advances in our understanding of risk-sensitive foraging preferences.Bateson M. Proceedings of the Nutrition Society 61 (4): 509-516 NOV 2002... animals are sensitive to the variance associated with alternative food sources ... Whether animals are risk-averse or risk-prone appears to depend on a range of factors, including the energetic status of the forager ... Why? yellow-eyed juncos (Caraco et al. 1990) The utility (value) of resources is notproportional to the quantity. u(ave quantity) utility u(mix, wins & loses) Jensen’s inequality u(mix, wins & loses) u(ave quantity) quantity lose ave win • If warm & fat - risk averse, • prefer average meal w/o variation • If cold & hungry - risk prone, • prefer to gamble on variable meals Twice as much more than twice as useful Gambling makes less sense if u(ave) payoff is high, little to gain Twice as much less than twice as useful Gambling makes more sense if u(ave)is low, little to lose Lottery tickets - a tax on the poor!
Habitat selection - where to exploit resources & Territoriality - when to defend Animals move to improve prospects for survival and/or repro. At ESS no benefit to moving. Defend if: benefits > costs (less competition) (of aggression)
1/3 Expected supply/demand or service/customer ? 1/2 1. Habitat selection: simple model: Idealfree - individual choices Ideal - know alternatives Free - to choose best option A game: each player’s move should depend on other player’s moves If equal demand/player & each player max’s expected return: -population equalizes supply/demand across patches -ratio of players matches ratio of supply & players get equal return
Two patches of bread bits supplied at equal rates: Relative number ducks matches relative supply rate Two patches of bread bits supplied at 2 to 1: Relative number ducks matches relative supply rate (ideal free habitat selection - continued) Harper’s ducks: Many other exp’s, esp w/ fish, show similar match supply/demand
1 2 Exp: Same # throws, but 2 bits per throw in patch 2 Initially duck pop matches proximate cues - throws, 1/2 ducks (=16) in patch 1 Eventually ducks figure new relationship between prox. cue = throws and ult. payoff = bread relative demand matches rel supply, 1/3 ducks (=11) in patch 1 (Harper’ ducks - continued) Ideal? How? Can’t assume ideal, esp. in novel, altered environments.
Wesplit the rootof ayoung pea … so thathalf grew in one pot and half in an adjacent pot ... “fence-sitter” … Each root-half was exposed either to no competition in its pot or tocompetitor plants sharing its pot. There were one, two, three or five competitor plants. The fence-sittershifted its root system from the pot with competition to that free of competition in proportion to the number of competitors… so that theratio between the roots was similar to the ratio between the resources in the pots. Gersani et al. 1998. Density-dependent habitat selection in plants. !!!!!! Evolutionary Ecology 12: 223-234. Abstract: Pea plants exhibitdensity-dependent habitat selection ... This result is analogous to the habitat-matching rule of the ideal free distribution of populations… plants invest in each of their roots until the uptake rate per unit root biomass is equal for all roots.
(ideal free habitat selection - continued) 1 1 1 1/4 Twice as big Expected supply/demand service/customer 1 ? 2 2 1/5 Unequal competitors? Differences in demand/individual (or competitive ability) should result in matching of - demand to supply but - not individuals to supply - individuals do not get identical returns
Random - at start Input match - 1 to 2 (=.33) Too many fish are in poor patch {undermatching} But, if measure competitive demand of individuals find: demand matches supply - many poor competitors (slow eaters) in poor patch Foraging site selection by juvenile coho salmon: Ideal free distributions of unequal competitors. Grand, TC. 1997. Animal Behaviour 53:185-196. When individuals differ in competitive ability, ideal free distribution theory predicts that animals should be distributed between habitats such that the distribution of their relative competitive abilities (or 'weights') matches the distribution of resources.
Spotted owls in our study tended to occupy territories with the highest λpf, supporting the assumption of ideal perceptual abilities. However, this relationship was noisy … Empirical support for a despotic distributionin a California spotted owl population Zimmerman et al. 2003. Behav. Ecol. 14:433-437. Territorial species such as the spotted owl are predicted to follow an idealdespoticdistribution. However, debate exists on whether wild populations actually meet the assumptions of an ideal distribution, such as perfect perceptual abilities (i.e., the ability to recognize high- and low-quality sites without error). We investigated whether occupancy rates of California spotted owl territories … positively correlated with a qualitative "potential fitness" (denoted by λpf) estimated from survival and reproduction of territorial owls. [We calculated occupancy rates of individual spotted owl territories as the proportion of years that a territory was occupied by a pair of owls. We calculated a potential fitness value (λpf) for each territory from estimates of survival and fecundity of owls that occupied those territories. ] {contrast w/ IFD – individuals defending best territories have higher repro success}
A team … tested experimentally to what extent birds make use of information gleaned by watching their neighbors, which ecologists call "public information.“ The researchers took nestlings from some nests and added them to others, creating some plots of woodland with supersized broods and others with measly numbers of young. The manipulation had a marked effect. Outsiders preferentially moved to plots augmented with nestlings, apparently judging these plots to be productive. {immigration} But youngsters on these plots were smaller. Emigrants picked up on both cues … They fled both treatment plots at high rates … Science News of the Week{Science’s News & Views} Birds Spy on Neighbors to Choose Nest Sites. Jay Withgott Information is power, even for birds. Faced with tough choices, animals that know how others have fared in comparable situations can make better decisions. On page 1168, {Doligez e al. 2002. Science 297:1168-1170.} researchers report that collared flycatchers decide where to nest and whether to return the next year based in part on knowledge of their neighbors' reproductive success. … Public information: From nosy neighbors to cultural evolution. Danchin et al. 2004. Sci.305: 487-491.
Predators (foragers) respond to distribution of prey Prey respond to predators (and counter moves) Food (bottom up) and the risk of predation (top down) both contribute to fitness, but calories and the probability of death are in different currencies, so optimization models have to work with the common currency of fitness which is often harder to measure and model that calories in foraging models. This is where dynamic programming models play an important role.
food Shocking electric kingfisher model Predation risk breaks size-dependent dominance in juvenile coho salmon ... and provides growth opportunities for risk-prone individuals. Reinhardt UG. 1999. Can. J. Fish. & Aquat. Sci. 56:1206-1212. Groups of coho salmon … fry in stream tanks formed size-determined dominance hierarchies … smaller fish occupying inferior feeding positions. … simulated predation risk … allowed small fish to gain access to better feeding positions. …
far near far near Reinhardt continued ... Smaller fry that chose to be in the exposed pool had greater growth rates than those that mainly occupied the refuge, … … the presence of predators creates opportunities for the expression of alternative behavioural strategies ... Differences in risk taking and growth among small coho fry … may support … a split into different life history trajectories.
Flies were found to conform fairly closely to the IFD. Predation risk had a major effect on their distribution, with fewer flies feeding in the presence of predators. Addition of extra food to the risky patch was successful in offsetting the risk of predation. The little Miss Muffet effect: Quantifying the effect of predation risk on foraging Riley C, Dill LM JOURNAL OF INSECT BEHAVIOR 18 (6): 847-857 NOV 2005 The ability of the ideal free distribution (IFD) to predict patch choice of female houseflies was determined by examining their distribution between two patches containing unequal amounts of food.{sugar cubes} The effect of predation risk was quantified by examining fly distribution between patches of equal food, with one containing spiders. Results were used to predict how much extra food must be added to the risky patch to offset the risk of predation.
Non-lethal effects of predators on prey: Predator-induced morphological changes in an amphibian: Predation by dragonfliesaffects tadpole shape and color. McCollum SA, Leimberger JD. 1997. Oecologia 109: 615-621. Abstract: … Gray treefrog (Hyla) … tadpoles reared with predatory dragonfly … larvae differ in shape and colorfrom tadpoles reared in the absence of dragonflies. By exposing tadpoles to tail damage and the non-lethal presence of starved and fed dragonflies, we determined that these phenotypic differences are induced by non-contact cues present when dragonflies prey on Hyla. The induced changes in shape are in the direction that tends to increase swimming speed; thus, the induced morphology may help tadpoles evade predators.…
McCollum SA, VanBuskirk J. 1996.Costs and benefits of a predator-induced polyphenism in the gray treefrog Hyla chrysoscelis. Evolution 50:583-593. Abstract: … gray treefrog (Hyla chrysoscelis) tadpoles… reared in ponds with predatory dragonfly larvae are relatively inactive … and have relatively large, brightly colored tailfins with dark spots along the margins. …induced phenotypes such as this should confer high fitness … when in the presence of predators, butshould be costly when the predator is absent. Our study tested for the predicted fitness trade-off…byfirst rearing tadpoles in mesocosms under conditions that induce the alternate phenotypes, and then comparing the performance of both phenotypes in both environments. … Tadpoles from the two environments showed significantly different behavior, tail shape, and tail color within two weeks of exposure. ...
… in ponds where there was no actual risk of predation … both phenotypes grew at the same rate, but thepredator-induced phenotypehad significantly lower survival thanthetypical phenotype, indicating thatinduced tadpoles suffered greater mortality from causes other than odonate predation. We tested the susceptibility of both phenotypes to predation by exposing them to dragonflies in 24-h predation trials. Thepredator-induced phenotype showed a significant survival advantage in these trials. Note that phenotypic plasticity allows ‘best of both worlds.’ “correct reject” “false alarm” % survival “hit” jargon from “miss” signal detection theory McCollum & VanBuskirk continued These results confirm that the predator-induced phenotype … is associated with fitness costs and benefits that explain why the defensive phenotype is induced rather than constitutive.
Pursuit-deterrent communication between prey animals and timber rattlesnakes: the response of snakes to harassment displays Clark RW 2005. Behav Ecol & Sociobiol 59 (2): 258-261. Most analyses of prey-predator communication are incomplete because they examine only the behavior of the prey. For example, research on interactions between rodents and rattlesnakes has focused on the behavior of rodent signalers, while responses of snakes have been virtually unexamined. Rattlesnakes are ambush predators ... ... After receiving displays, foraging {hunt} snakes left their ambush sites and moved long distances before locating subsequent ambush sites, indicating that they responded to displays by abandoning attempts to ambush prey in the vicinity of signalers. {Basking snakes keep basking}