Download
1 / 8
80 likes | 175 Views
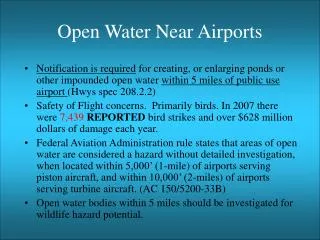
Open water area Franks Tract. Problem statement. Model assumes uniform and instantaneous mixing over entire open water area Significant salinity gradient within Recent field measurements allow the possibility of estimating potential error.

E N D
Open water area Franks Tract
Problem statement • Model assumes uniform and instantaneous mixing over entire open water area • Significant salinity gradient within • Recent field measurements allow the possibility of estimating potential error
Figure III.3-1. US Geological Survey monitoring stations in and surrounding Franks Tract, April to August 2002. Old River at San Joaquin River Fisherman’s Cut False River Franks Tract West, FRW Old River at Mandeville Island Taylor Slough Franks Tract East, FRE Sand Mound Slough Holland Cut
Figure III.3.i-4. Salinity variation in Franks Tract. (right scale)
First estimate of error in salt flux calculation: Compare salt fluxes based on measured flows and salinity of: • Average of FRE and FRW • Actual salinity measured in channels • Caveats: • Modeled salinity could be different • Volume between salinity stations in channel and perimeter of Franks Tract.
Figure III.3.i-9. Tidally-averaged salt flux. b. Sum of Old River at Mandeville Island and Holland Cut Godin-filtered and in units of acre-feet • PSU
Figure III.3.i-9. Tidally-averaged salt flux. c. False River Godin-filtered and in units of acre-feet • PSU
Observations Possible large percentage error in salt flux estimates Other sources of inaccuracies: • uniform water level • vertical stratification • gate-type formulation Alternate formulations • as wide channels • as multiple basins