Download
1 / 25
250 likes | 366 Views
Observational studies vs. RCTs Jonas Ranstam PhD Department of Clinical Sciences, Lund University, and Skane University Hospital, Lund jonas.ranstam@med.lu.se. Registries are good, RCTs bad, and vice versa - RCTs underestimate revision rates

E N D
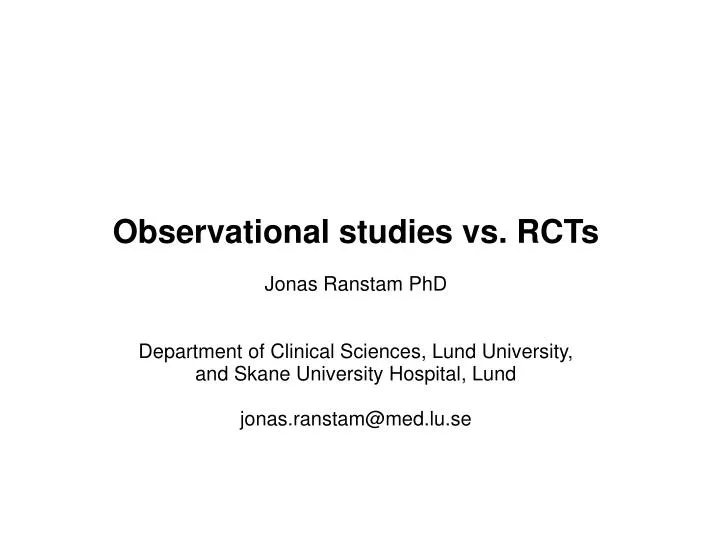
Observational studies vs. RCTs Jonas Ranstam PhD Department of Clinical Sciences, Lund University, and Skane University Hospital, Lund jonas.ranstam@med.lu.se
Registries are good, RCTs bad, and vice versa - RCTs underestimate revision rates - RCTs say little about how well an implant works in practice - RCTs do not provide externally valid results - Registries can only study a limited number of endpoints - Registries offer limited possibilities for case-mix adjustment - Registries do not provide internally valid results
RCTs are not for studying long term safety RCTs may provide an opportunity to gather useful information about adverse effects, but limited sample size and short follow up makes RCTs unsuitable for studying the long term safety of joint replacements. Observational studies are better for long term safety surveillance.
RCTs are not for studying how well an implant works in practice (effectiveness) RCTs may provide an opportunity to gather useful information about effectiveness, but limited sample size, short follow up, inclusion/ exclusion criteria, protocol regulated follow up and compliance measures makes RCTs unsuitable for studying the effectiveness of joint replacements. Observational studies are better for studying effectiveness.
RCTs are for studying the capacity for therapeutic effect (efficacy) Some devices, like cochlear implants, may require efficacy trials. A registry is not useful for this purpose. The efficacy of a joint replacement is obvious.
A few facts about randomization The purpose is not to create identical treatment groups. It is meaningless to test if the randomization has been “successful”. The purpose of randomization in RCTs was originally (the British Streptomycin trial, 1948) to enable blinded treatment. Concealed treatment allocation is important for avoiding selected inclusion.
Randomization and confounding Randomization “converts” potential confounding effects to random errors. This makes them evaluable with statistical hypothesis tests. Observational studies rely on statistical adjustment to remove the systematic errors. This, can only be performed with insight into the studied mechanisms.
Regression adjustment and bias Successful adjustment for confounding bias requires knowledge about causal relationships. Data driven methods don't work. Covariate Adjustment reduces bias Exposure Effect Covariate Adjustment creates over-adjustment bias Exposure Effect Covariate Adjustment creates collider stratification bias Exposure Effect
Alzheimer's Disease Confounding bias Females r ≈ 0, p = 0.9 Crude [biased] correlation r ≈ 0.5, p < 0.001 Males r ≈ 0, p = 0.9 Adjusted [true] correlation r ≈ 0, p = 0.9 (Aluminium)
Alzheimer's Disease Confounding bias Females r ≈ 0.6, p < 0.001 Crude [biased] correlation r ≈ 0, p = 0.9 Males r ≈ 0.6, p < 0.001 Adjusted [true] correlation r ≈ 0.6, p < 0.001 (A specific toxin)
ᄃ Over-adjustment bias Heart Disease Yellow fingers r ≈ 0.3, p < 0.001 Crude [true] correlation r ≈ 0.7, p < 0.001 Adjusted [biased] correlation r ≈ 0.3, p < 0.001 No yellow fingers r ≈ 0.3, p < 0.001 (Smoking)
Collider stratification bias Breast cancer Screening non-participants r ≈ 0.5, p < 0.001 Crude [true] correlation r ≈ 0, p = 0.9 Screening participants r ≈ 0.5, p < 0.001 Adjusted [biased] correlation r ≈ 0.5, p < 0.001 (Education)
Confounding/adjustment bias A directed acyclic graph (DAG) for confounding adjustment of bias when estimating the causal effect of warming up on the risk of injury.
Propensity scores (PS) and causal inference “[T]he use of PS methods … may actually increase, not decrease, bias. Shrier … provides a simple example; the crude estimate is bias-free, while PS methods introduce new bias.” Pearl J. Remarks on the method of propensity score. Statistics in Medicine 2009;28:1415–1424. See also: Rubin D. The design versus the analysis of observational studies for causal effects: Parallels with the design of randomized trials. Statistics in Medicine 2007; 26:20–36. Shrier I. Letter to the editor. Statistics in Medicine 2008; 27:2740–2741. Rubin D. Author’s reply (to Ian Shrier’s Letter to the Editor). Statistics in Medicine 2008; 27:2741–2742.
Propensity scores (PS) and causal inference “The standard practice when estimating a treatment effect is to include all available pre-treatment variables, and we demonstrate that this approach is not always optimal when the goal is bias reduction. We characterize the conditions under which including an additional relevant variable in the propensity score increases the bias...” Clarke KA, Kenkel B, Rueda MR. Misspecification and the Propensity Score: The Possibility of Overadjustment. University of Rochester. March 8, 2013.
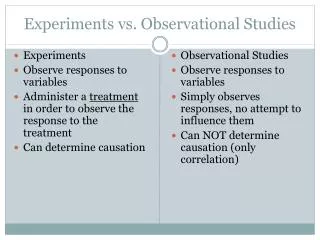
The same methods, but different purposes Observational studies Regression models are used to adjust for confounding factors. RCTs Regression models are used to reduce variance by conditioning on randomization stratification factors.
Observational studies and RCTs require different statistical analyses Common mistakes - ignoring confounding adjustment in an observational study - adjusting for potential confounding factors in an RCT - not adjusting for baseline and randomization stratification factors - ignoring multiplicity issues in an RCT
Multiplicity issues When several different null hypotheses are tested, each at a 5% significance level, the probability of at least one of these null hypotheses are erroneously rejected is greater than 5%.
Multiplicity issues About much more than Bonferroni correction For example: - When is it necessary, and when is it not? - What about secondary endpoints? - What about subgroup analyses? - What about “responders”? - What about composite endpoints?
Greater uncertainty in observational studies Observational studies The uncertainty of the confounding adjustment is unknown. Multiplicity effects are disregarded. RCTs The uncertainty of potential confounding factors is included in p-values and confidence intervals. The type 1 error rate is usually protected by a well defined strategy for addressing multiplicity issues.
RCTs provide the highest level of evidence “The principle of science, the definition, almost, is the following: The test of all knowledge is the experiment. Experiment is the sole judge of truth.” Richard Feynman