Download
1 / 18
180 likes | 313 Views
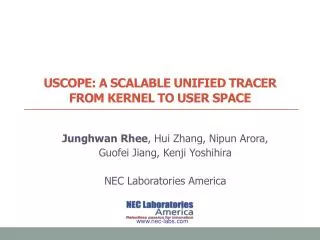
Uscope : A scalable Unified tracer from kernel to user space. Junghwan Rhee , Hui Zhang, Nipun Arora, Guofei Jiang, Kenji Yoshihira NEC Laboratories America. www.nec-labs.com. Motivation. Errors. Performance. Security.

E N D
Uscope: A scalable Unified tracer from kernel to user space Junghwan Rhee, Hui Zhang, Nipun Arora, Guofei Jiang, Kenji Yoshihira NEC Laboratories America www.nec-labs.com
Motivation Errors Performance Security • IT software faces diverse functional and non-functional issues due to complexity of software and usage of underlying components. • OS tracing is a convenient method to monitor and debug system operations without hard dependency on application layers (e.g., Libraries, program binaries). • Example: System call trace • However, OS events can be triggered by diverse programs and code. Therefore there is semantic gap to understand application program behavior from OS events.
Unified Tracing App B App A App B App C main main main main ? App C App A User Space fA,1 fB,1 fC,1 fB,P … … … ? ? User Probe Library Library Library syscall Kernel • Type 1 Unified Tracing • (User space to Kernel) (b) Type 2 Unified Tracing (Kernel to User space) • Trace logs across the boundary of kernel and space • i.e., user stack trace on OS kernel events • Examples: Dtrace, Windows ETW, System Tap • Two types of Unified Tracing
Type 2 Unified Tracing App A App B App C main main main ? fA,1 fB,1 fC,1 … … … ? ? Library Library Library syscall Type 2 Unified Tracing (Kernel to User space) • Type 2 unified tracers generate events on kernel events of interest. • A typically used technique to collect user space code information is stack walking. • Tracer finds the user process stack in the current context and scan stack frames from the stack pointer address. • Examples • Ustack of Dtrace, Stackwalking of Microsoft ETW • These solutions have been generally used for debugging scenarios. How we can lower overhead?
Challenges : Tracing Focus Figure: A process hierarchy of an idle desktop machine • Tracing all programs? • There are numerous processes in typical desktop and server systems at runtime for various purposes (e.g., multitasking, administration, accounting, users’ daemons). • Unless the user has no idea on which programs went wrong, tracing all processes is not ideal.
Challenges : Tracing Focus Apache Controller forks a child Child of the Apache Controller becomes the Apache daemon. Apache daemon forks children on demand. • Tracing an application software? • Programs create and kill many sub processes dynamically. • Some processes change their identity (execve system calls). • How to systematically track all processes from their start? (instead of giving PIDs to tracers)
Challenges : Tracing Focus LibC Libraries Program • Tracing the whole stack? • Programs may have deep stacks. ECLIPSE project reported that the collected stack trace ranged from 1 ~ 1024 stack frames. • A stack includes function call information of multiple software layers (programs, libraries, middleware, and kernel etc.) • Not every stack layer may be in users’ interest.
Uscope: Systematic Unified Tracer LibC Libraries Program • Flexible and configurable tracing scopes • Efficient per-application tracing • Systematic tracking of dynamic processes • A highly configurable focus within the call stack
Uscope Architecture App B App A App C User Space Process 1 Unified Trace App B OS Kernel OS Kernel Per-App Tracing Flexible Stack Walking Kernel Tracing Target User Tracing Target Tracing Mode • Input: • Kernel Tracing Target : the kernel events that generate log events • User Tracing Target : the application software to be traced • Tracing Mode : specification on the call stack focus to be traced • Output: • Unified Trace for an application software
Per-Application Tracing Logic Add a new process Remove a process Invalidate CRLT Kernel Event exit execve fork Trace Map 3 execve PID Name PTR Is it a Kernel Tracing Target? Get the current PID 1 2 … PTR A 101 PTR A 102 Dynamic Process Management Layer OUT B 5 103 … Obtain CRLT via PTR Flexible Stack Walking 6 A PTR Null 104 104 ? (New) Return Set up CRLT/PTR 4 8 7 This diagram shows the logic how Uscope performs per-application tracing and systematic tracking of dynamic processes. Trace map maintains the sets of processes (1) unknown, (2) to trace, and (3) not to trace. Kernel events making dynamic changes of processes (e.g., fork, exit, execve) trigger corresponding changes on the trace map.
Flexible Call Stack Scope Mode 1 (App) Mode 2 (App All) Mode 3 (Library) Mode 4 (All) Call stack during a Syscall Unrecorded call site C1,1 C1,1 C1,1 C1,1 C1,1 C1,2 C1,2 C1,2 C1,2 C1,2 … … … … … Recorded call site R1 C1,n1 C1,n1 C1,n1 C1,n1 C1,n1 … … … … … Stack walking Ck,1 Ck,1 Ck,1 Ck,1 Ck,1 Ck,2 Ck,2 Ck,2 Ck,2 Ck,2 … … … … … RK Ck,nk Ck,nk Ck,nk Ck,nk Ck,nk Recorded call sites during stack walking Syscall Uscope provides flexible call stack scopes in tracing. Maximum budge S. Further fine control is available.
Implementation • Tracer • Implemented by extending SystemTap. • SystemTaphooks system calls to generate log events. • Trace map and tracing logic is implemented as a kernel module. • RedhatEnterprise Linux 5 is supported. • Input: • Kernel Tracing Target : System call events • User Tracing Target : Apache webserver (Server workload), MySQL database (Server workload), Nbench (computation) • Uscope can be dynamically attached and detached to the kernel at runtime. When it is detached, there is no overhead.
Runtime Overhead • Workload • Apache : Apache HTTP Benchmark tool (ab), 100 concurrency, 10^6 requests • MySQL : MySQL Benchmark suite (alter-table, ATIS, big-tables, connect, create, insert, select, transactions, and wisconsin) • Nbench : Linux/Unix of BYTE’s Native Mode Benchmarks (verison 2.2.3). “Memory Index”, “Integer Index”, and “FP Index” are used. • Tracing Modes : • Mode 1 : application call stack layer, the last stack frame • Mode 2 : application call stack layer, 3 or 5 last stack frames • Mode 3 : all layers, the last stack frames up to 5 • Less than 6% overhead in three benchmarking cases
Case Study Application 1 • Testbed • Three tier PetStore system (Apache, Jboss, MySQL) • Symptom • Web requests failed. • Tracing: Mode 2 (S=3) • Dual Space Analysis • X axis shows different types of system calls and Y axis shows application code (i.e., triggers). • Unique events in normal case • Read: my_read • Accept: handle_connections_socket • More.. • Unique events in abnormal case • Stat: archive_discover • => Problem in accessing the database file
Case Study Application 2 Workers Listener deadlock . . . futex . . . futex Sys Calls ? ? deadlock Program LOCK (timeout) . . . UNLOCK(timeout) . . . LOCK (idlers) . . . SIGNAL (waits) . . . UNLOCK(idlers) . . . LOCK (timeout) . . . LOCK (idlers) . . . COND_WAIT (waits, idlers) . . . UNLOCK (idlers) . . . UNLOCK(timeout) User code context • Testbed • Apache Webserver • Symptom • Concurrency error that threads are in a deadlock condition (Case number: Apache #42031) • Tracing: Mode 2 (S=5) • Call Stack Analysis • Call stacks on futex system calls are captured and analyzed. • Worker Thread • apr_thread_mutex_call (a wrapper of pthread_mutex_call) • Listener Thread • apr_thread_cond_wait (a wrapper of pthread_cond_wait) • => Deadlock conditions are identified.
Limitations • System-Call-Driven • There are computation intensive applications functions that do not cause system calls. • Coverage can be extended by triggering stack walking in context switch. • Native vs. Non-native Programs • Uscope works on native programs written in C/C++. • Non-native programs such as Java and interpreter languages can be supported by integrating stack parsing logics. For example, jdb and jstack support stack walking of java stack and native stack.
Conclusion Uscope provides efficient type 2 unified tracing for kernel and unknown user code. Uscope provides per-application tracing, systematic tracing of dynamic processes, and flexible specification on call stack scopes to be traced. Our prototype has 6% overhead compared to native execution in several benchmarks. Also we showed two case studies how unified tracers can be used for debugging.