Download
1 / 14
140 likes | 377 Views
Impact of Ozone-Alkene Reactions on Formaldehyde Mixing Ratios during the Texas Air Quality Study 2006. Beata Czader, Bernhard Rappenglück, Daewon W. Byun, Soontae Kim, Fong Ngan Department of Earth and Atmospheric Sciences University of Houston. Sources of Formaldehyde. Primary

E N D
Impact of Ozone-Alkene Reactions on Formaldehyde Mixing Ratios during the Texas Air Quality Study 2006 Beata Czader, Bernhard Rappenglück, Daewon W. Byun, Soontae Kim, Fong Ngan Department of Earth and Atmospheric Sciences University of Houston
Sources of Formaldehyde Primary Emissions from car exhaust or industrial production (flares, refinery cracking) Secondary Chemical Production in the air from ethene and other alkenes, such as ethene and propene VOC + OH → HCHO VOC + O3 → HCHO • The average daytime formaldehyde concentration is ~ 5 ppb. Measurements during TexAQS 2006 campaign registered high daytime formaldehyde peaks reaching 30 ppbv. • High nighttimes formaldehyde concentration of 15 ppb measured on several nights [Rappenglück et al. 2009].
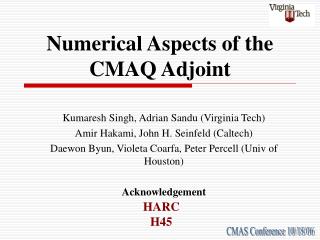
Modeling Setup Simulations with CMAQ 4.6 performed with SAPRC-99 chemical mechanism Model set up: 82 columns, 64 rows, 23 layers, 4 km grid cells • Emission Inventory: • Texas Point Source Inventory 2006 (TPSI2006) • TCEQ’s area, mobile, and biogenic emissions • National Emission Inventory 2002 (NEI 2002) Meteorological fields: MM5 simulations; grid nudging in U/V/T/Q; updated TSF 2000 LULC data; UH modified MRF and NOAF LSM scheme. Lynchburg Ferry Moody Tower Process Analysis: data averaged horizontally in 3x3 grids, vertically in all layers up to PBL height
F F
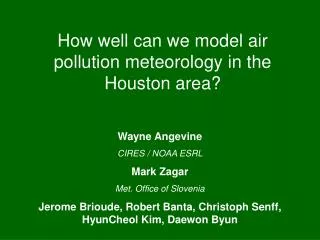
Contribution of different reactions to change in formaldehyde mixing ratio on Aug. 27 – Sep. 01, 2006 HCHO + OH→ HO2 + CO HCHO + NO3→ HNO3 + NO2 + CO F
Contribution of different reactions to change in formaldehyde mixing ratio on Aug. 27 – Sep. 01, 2006 F
ETH + O3 → 1.0 HCHO ETH + HO → 1.6 HCHO OLE1 + HO → 0.73 HCHO OLE1 + O3 → 0.5 HCHO OLE2 + O3 → 0.3 HCHO OLE2 + HO → 0.24 HCHO
C_O2 + NO CH3O2 + NO → CH3O + NO2 CH3O + O2→ HCHO + HO2 HCHO + HO2 CCO_O2 + NO CH3C(=O)O2 + NO → CH3(=O)O + NO2 CH3C(=O)O + O2→ CH3O2 + CO2 C_O2 CH3C(=O)O2 + NO2 ↔ CH3C(=O)O2NO2 CCO_O2 + NO2 PAN Methylperoxy radical formaldehyde from methylperoxy radical peroxyacyl radical forming methylperoxy radical peroxyacyl radical ↔ peroxyacyl nitrate
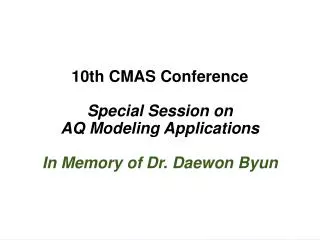
Contribution of ozone – alkene reactionsandreactions of OH, NO3, NO
Conclusions • On several nights there is a contribution from chemical reactions to formaldehyde formation. • Reactions of ozone with alkenes have the most contribution to nighttime chemistry. • There is also a significant contribution of NO reactions with methylperoxy radical in producing formaldehyde during nighttimes. • Up to ~ 5 ppbv of formaldehyde may be formed from chemical reactions over the course of night.