Download
1 / 26
260 likes | 445 Views
Demand. The desire, ability, and willingness to buy a product Demand Schedule- shows the amount demanded at every price. Demand Curve. Shows the quantity that consumers will demand at each and every price. http://www.youtube.com/watch?v=ZaCbtFnmQsQ. Law of Demand.

E N D
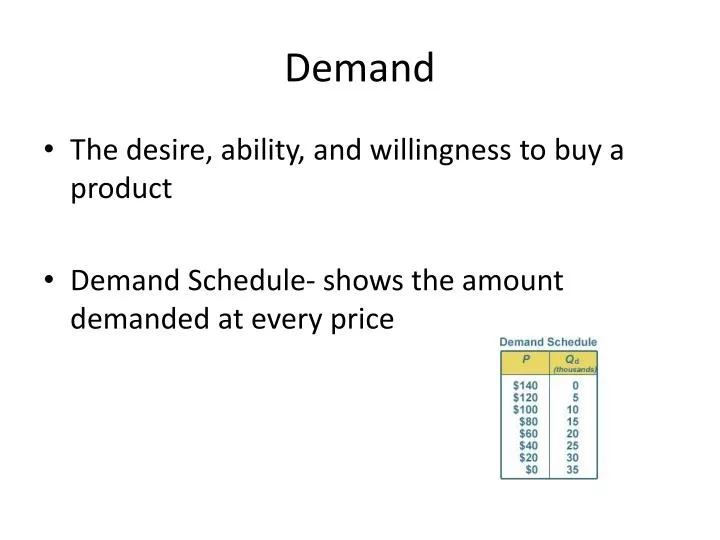
Demand • The desire, ability, and willingness to buy a product • Demand Schedule- shows the amount demanded at every price
Demand Curve • Shows the quantity that consumers will demand at each and every price. • http://www.youtube.com/watch?v=ZaCbtFnmQsQ
Law of Demand • Demand is higher at lower prices and lower at higher prices • Inverse relationship http://www.youtube.com/watch?v=uXlZIn6W7Ew&feature=related
Change in Demand vs. Change inQuantity Demanded Change in Demand • People buy different amounts at the same prices • Shows a move (shift) from one curve to the other • http://www.youtube.com/watch?v=JG8PpJxpVvo&feature=related Change in Quantity Demanded • Affected by price • Moves along the same curve
Non-Price Determinants Demand is also affected by non-price factors: • Tastes and preferences of consumers • Related goods (prices of the related goods) • Complements • substitutes • Income of consumers • Number of buyers • Expectations of consumers T R I B E
Prices of related goodsSubstitutes and Complements Substitutes: • Competing products that can be used in place of one another • An increase in the price of one increases the demand for the other • Ex: Coke and Pepsi Complements: • Products that increase the value of other products • An increase in the price of one reduces the demand for both • An increase in the use of one will increase the use of the other • Ex: computers and software
Marginal Utility • Satisfaction or usefulness obtained from acquiring one more unit of a product • http://www.youtube.com/watch?v=4nC9ioNqizY&feature=related • Ex: Lemonade on a hot day • What happens when you drink too much lemonade?
Diminishing Marginal Utility • Decreasing satisfaction or usefulness as additional units of a product are acquired • More units bought = less eager to buy • Ex: Arby’s 5 for $5 = 1st (delicious), 2nd (good/ok), 3 ( stomach hurts), 4&5 (trash)
Elastic or Inelastic? Because some goods and services are affected by price morethan others, we classify demand as either elastic or inelastic.
Elastic or Inelastic? Elastic • Small price changes can make big changes in demand • Amount bought will go up when price goes down • You can wait to buy Inelastic • Price changes don’t affect demand • Lower price will NOT affect the amount bought • You can’t wait to buy
How is elasticity determined? • Can the purchase be delayed? or is it a necessity? • Yes = elastic Yes=inelastic • No = inelastic No=elastic • Are adequate substitutes available? • Yes = elastic • No = inelastic • Does the purchase use a large portion of your income? • Yes = elastic (Ex: car) • No = inelastic (Ex: salt)
Check your understanding • Draw a demand curve: • As the price of CDs goes up, does the quantity that you demand go up or down? • This is known as the ________ ___ ________. • What are some factors that might change the demand for CD’s?
Supply • The quantity of goods and services that sellers are willing and able to supply
Law of Supply • If prices are high, suppliers will offer greater quantities for sale • If prices are low, they will offer smaller quantities • There is a direct relationship between supply and price • A change in the quantity supplied is often the result of a change in price • How does this conflict with the Law of Demand?
Supply Curve • The tendency of suppliers to offer greater quantities for sale at higher prices • “An upward Sloping curve”
Changes in Supply • Changes in supply can occur for non-price reasons. These are the non-price determinants • Resource Costs - Cost of Inputs • Other Goods or other opportunities • Taxes and/or subsidies • Technology and productivity • Expectations • Number of Sellers ROTTEN
Costs related to production • Fixed costs: remain the same (overhead) • Ex: rent payments, salaries, etc. • Variable costs: change with the rate of operation; costs of raw materials, electric bill, etc. • Total cost: sum of the fixed and variable costs • http://www.youtube.com/watch?v=nQ5APwtB-ig
Cost affects Profit • Profits: profit is determined by taking total costs away from total revenue. • Total Revenue: the number of units sold times the price per unit. • 50 units x $2 each = $100 total revenue • Break-even point = total revenue minus total cost (this is not ideal) • Total revenue > total cost = profit (Ideal!) • Total revenue < total cost = debt, bankruptcy, etc.
Prices • Equilibrium price: the price at which the quantity supplied is equal to the quantity demanded. S = D (market is cleared) • Surplus: quantity supplied is greater than the quantity demanded S > D • Shortage: quantity supplied is less than the quantity demanded S < D • Price ceiling: the highest price that can be charged, according to an agent outside the market (NYC rent controls) • Price floor: the lowest price that can be charged according to an agent outside the market (minimum wage)