Download
1 / 33
330 likes | 350 Views
Explore comprehensive socio-economic data on ethnicity, with detailed analyses on unemployment, education, health, and family compositions using SARs. Discover crucial insights on ethnic penalties and mixed couples' dynamics.

E N D
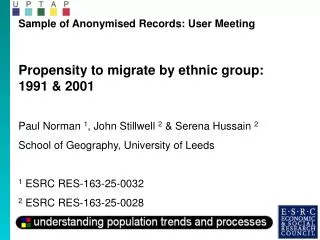
Samples of Anonymised Records: a resource for ethnicity research Ed Fieldhouse Director, SARs Support team http://www.ccsr.ac.uk/sars
Key features of the SARs • Coverage • Full range of census variables • Size • Ethnicity and religion • Geography • Multivariate/flexibility • Household structure • Comparability with other census products • Easy access
Individual SAR • 3% sample of individuals from UK • 1.84 million records • All census variables present • Lowest geography – GOR • Access • End User Licence (via Athens for academics • Do not attempt to identify anyone • Do not pass on data to unregistered individual
Controlled Access Individual SAR • 3% sample of individuals from UK • 1.84 million records • All census variables present with very great detail • Lowest geography – LA • Access • Only within 4 ONS offices • Rigorous application procedure by ONS • Careful vetting of outputs by ONS
Household SAR • 1% sample of households, E & W only • 225K Households; 525K individuals • All census variables present • No geography • Individuals linked within household • Access • Special Licence - administered by UKDA • More restrictive than EUL, eg cannot use on laptop • Applications need approval by ONS
Controlled Access Household SAR • Same sample as SL-Household SAR, but also contains Scotland and NI • All census variables present with very great detail • Lowest geography – LA • Access • Only within 4 ONS offices • Rigorous application procedure by ONS • Careful vetting of outputs by ONS
Small Area Microdata (SAM) • 5% sample of Individuals from UK • 2.96 million records • Most census variables present – restricted detail • Lowest geography – LA • Access • End User Licence (via Athens for academics) • Do not attempt to identify anyone • Do not pass on data to unregistered individual
The 1991 Census ethnic group question asked in England, Wales and Scotland
The 2001 Census ethnic group question asked in England and Wales
The 2001 Census ethnic group question asked in Northern Ireland
Ethnic Group for England and Wales – 2001 3% Individual Licensed SAR
Comparison of ethnic group categories in 1991-2001 Census From Simpson and Akinwale, 2006
Key research areas on ethincity using SARs • Ethnic differences in unemployment • Ethnic differences in educational attainment and participation • Ethnic differences in class attainment • Ethnic composition of families • Ethnic differences in health
Research findings: 1991 SARs: Unemployment • In contrast to the small sample size of survey data which forces many researchers to over-collapse the categories and call all minority ethnic groups 'black', the SARs allows for detailed analysis of ethnic groups. • Differences both between and within major ethnic groups can be explored in various aspects of their socio-economic lives while at the same time controlling for other important characteristics. • Blackburn, Dale and Jarman (1997) showed striking differences between ethnic groups in the vulnerability to unemployment, even among people with the same level of educational qualifications. One in five (20 per cent) of UK-born Black-African men and women with higher qualifications were unemployed, but the rate for similarly qualified UK-born Whites was only one fifth as many (3 to 4 per cent). This is a case of what might be called 'ethnic penalty' • See also Fieldhouse and Gould, 1998 on how ethnic penalties are affected by local labour market conditions using sub-regional geography in SAR • Similar work by Simpson et al (for DWP) and Heath et al using 2001 SARs
Impact of age, sex, qualifications and country of birth on economic activity (source DWP Research Report 333)
Impact of age, sex, qualifications and country of birth on economic activity (source DWP Research Report 333
‘Ethnic penalties’ on women's economic activity (source DWP Research Report 333
‘Ethnic penalties’ on men’s unemployment (source DWP Research Report 333
Accessing the files • EUL files available online following standard registration with the Census Registration System • Licensed Individual file 2001 • Small Area Microdata file 2001 • 1991 1% household and 2% individual SARs • Special licence Household SAR (via UKDA) • CAMS – controlled access allowed via ONS at specified sites