Analysis of Peanut Production Profitability in Georgia from 1998 to 2002
Georgia's peanut production has experienced moderate growth over the past decade, yet profit margins have faced challenges due to lower prices, yielding declines, and rising costs. This report details annual revenue, variable, and fixed costs associated with peanut production between 1998 and 2002. It includes mathematical models for revenue and total costs, along with a profit function P(x), which allows for forecasting future profits, notably for 2010. Key interpretations relate to the rate of change in profits over time.

Analysis of Peanut Production Profitability in Georgia from 1998 to 2002
E N D
Presentation Transcript
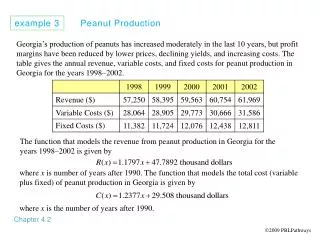
example 3 Peanut Production Chapter 4.2 Georgia’s production of peanuts has increased moderately in the last 10 years, but profit margins have been reduced by lower prices, declining yields, and increasing costs. The table gives the annual revenue, variable costs, and fixed costs for peanut production in Georgia for the years 1998–2002. The function that models the revenue from peanut production in Georgia for the years 1998–2002 is given by where x is number of years after 1990. The function that models the total cost (variable plus fixed) of peanut production in Georgia is given by where x is the number of years after 1990. 2009 PBLPathways
Georgia’s production of peanuts has increased moderately in the last 10 years, but profit margins have been reduced by lower prices, declining yields, and increasing costs. The table gives the annual revenue, variable costs, and fixed costs for peanut production in Georgia for the years 1998–2002. The function that models the revenue from peanut production in Georgia for the years 1998–2002 is given by where x is number of years after 1990. The function that models the total cost (variable plus fixed) of peanut production in Georgia is given by where x is the number of years after 1990.
Write a function P(x) that models the profit from peanut production. Graph the functions R, C, and P on the same set of axes. What is the slope of the graph of P(x)?Interpret the slope as a rate of change. If the model remains accurate, what will be the profit for peanut production in 2010?
? Write a function P(x) that models the profit from peanut production.
? Write a function P(x) that models the profit from peanut production.
? Write a function P(x) that models the profit from peanut production.
? Write a function P(x) that models the profit from peanut production.
? Write a function P(x) that models the profit from peanut production.
? Write a function P(x) that models the profit from peanut production.
? Write a function P(x) that models the profit from peanut production.
? Write a function P(x) that models the profit from peanut production.
? Write a function P(x) that models the profit from peanut production.
? Write a function P(x) that models the profit from peanut production.
Write a function P(x) that models the profit from peanut production.
Graph the functions R, C, and P on the same set of axes. R(x) C(x) P(x)
What is the slope of the graph of P(x)?Interpret the slope as a rate of change. m = -0.058 b = 18.2812 -0.058 thousand dollars per year or -58 dollars per year
What is the slope of the graph of P(x)?Interpret the slope as a rate of change. m = -0.058 b = 18.2812 -0.058 thousand dollars per year or -58 dollars per year
What is the slope of the graph of P(x)?Interpret the slope as a rate of change. m = -0.058 b = 18.2812 -0.058 thousand dollars per year or -58 dollars per year
What is the slope of the graph of P(x)?Interpret the slope as a rate of change. m = -0.058 b = 18.2812 -0.058 thousand dollars per year or -58 dollars per year
If the model remains accurate, what will be the profit for peanut production in 2010?
If the model remains accurate, what will be the profit for peanut production in 2010?
If the model remains accurate, what will be the profit for peanut production in 2010?