Download
1 / 52
520 likes | 614 Views
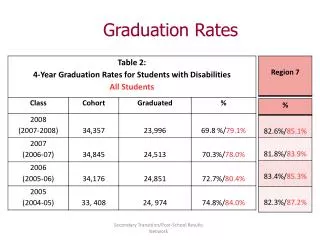
Explore graduation rates, retention rates, and employment statistics of first-time-in-college and associate in arts-transfer students at Florida universities from 1993 to 2004. Understand teacher certification pass rates and post-graduation employment trends for baccalaureate graduates. Compare university performance based on various criteria to make informed decisions.

E N D
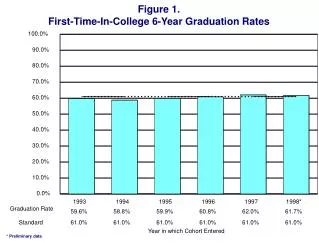
Figure 1.First-Time-In-College 6-Year Graduation Rates 100.0% 90.0% 80.0% 70.0% 60.0% 50.0% 40.0% 30.0% 20.0% 10.0% 0.0% 1993 1994 1995 1996 1997 1998* Graduation Rate 59.6% 58.8% 59.9% 60.8% 62.0% 61.7% Standard 61.0% 61.0% 61.0% 61.0% 61.0% 61.0% Year in which Cohort Entered * Preliminary data
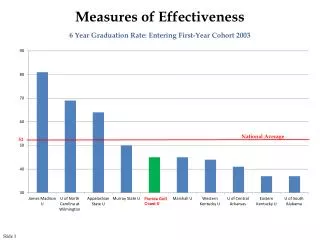
Figure 2. First-Time-In-College 6-Year Graduation RatesUniversity Performance, 1998 Cohort 100.0% 90.0% 80.0% 70.0% 60.0% 50.0% 40.0% 30.0% 20.0% 10.0% 0.0% UF FSU FAMU USF FAU UWF UCF FIU UNF FGCU SUS Graduation Rate 78.3% 64.3% 45.6% 44.7% 35.1% 41.2% 54.5% 44.6% 47.4% 29.6% 61.7%
Figure 3.First-Time-In-College 6-Year Retention Rates 100.0% 90.0% 80.0% 70.0% 60.0% 50.0% 40.0% 30.0% 20.0% 10.0% 0.0% 1993 1994 1995 1996 1997 1998* RetentionRate 70.2% 68.9% 69.6% 70.1% 71.0% 70.8% Standard 71.0% 71.0% 71.0% 71.0% 71.0% 71.0% * Preliminary data Year in which Cohort Entered
Figure 4. First-Time-In-College 6-Year Retention RatesUniversity Performance, 1998 Cohort 100.0% 90.0% 80.0% 70.0% 60.0% 50.0% 40.0% 30.0% 20.0% 10.0% 0.0% UF FSU FAMU USF FAU UWF UCF FIU UNF FGCU SUS RetentionRate 80.8% 67.0% 59.4% 55.7% 44.5% 49.9% 60.4% 59.5% 54.1% 35.4% 70.8%
Figure 5.Associate in Arts-Transfer Graduation Rates 100.0% 90.0% 80.0% 70.0% 60.0% 50.0% 40.0% 30.0% 20.0% 10.0% 0.0% 1995 1996 1997 1998 1999 2000* Graduation Rate 68.2% 69.5% 68.9% 68.5% 68.9% 70.4% Standard 69.0% 69.0% 69.0% 69.0% 69.0% * Preliminary data Year in which Cohort Entered
Figure 6. Associate in Arts-Transfer Graduation RatesUniversity Performance, 2000 Cohort 100.0% 90.0% 80.0% 70.0% 60.0% 50.0% 40.0% 30.0% 20.0% 10.0% 0.0% UF FSU FAMU USF FAU UWF UCF FIU UNF FGCU SUS Graduation Rate 79.2% 70.4% 68.3% 64.5% 62.8% 66.8% 68.1% 62.8% 65.9% 56.2% 70.4%
Figure 7.Associate in Arts-Transfer Retention Rates 100.0% 90.0% 80.0% 70.0% 60.0% 50.0% 40.0% 30.0% 20.0% 10.0% 0.0% 1995 1996 1997 1998 1999 2000* Retention Rate 78.3% 79.6% 79.2% 79.1% 79.5% 80.9% Standard 80.0% 80.0% 80.0% 80.0% 80.0% 80.0% * Preliminary data Year in which Cohort Entered
Figure 8. Associate in Arts-Transfer Retention RatesUniversity Performance, 2000 Cohort 100.00% 90.00% 80.00% 70.00% 60.00% 50.00% 40.00% 30.00% 20.00% 10.00% 0.00% UF FSU FAMU USF FAU UWF UCF FIU UNF FGCU SUS Retention Rate 84.60% 76.20% 77.80% 77.50% 76.10% 75.90% 77.30% 77.00% 76.50% 68.70% 80.90%
Figure 9.Percentage of Students GraduatingWithin 115% of Degree Requirements 100.0% 80.0% 60.0% 40.0% 20.0% 0.0% 1999-00 2000-01 2001-02 2002-03 2003-04* All 67.9% 68.3% 67.8% 67.3% 66.9% FTICs 55.5% 55.9% 56.5% 56.2% 55.6% AA-Trans. 77.7% 78.3% 78.3% 78.1% 78.5% Standard 61.0% 61.0% 69.0% 69.0% * Preliminary Data
Figure 10. Percentage of Students GraduatingWithin 115% of Degree RequirementsUniversity Performance, 2003-04* 100.0% 90.0% 80.0% 70.0% 60.0% 50.0% 40.0% 30.0% 20.0% 10.0% 0.0% UF FSU FAMU USF FAU UWF UCF FIU UNF FGCU All 61.3% 71.3% 36.9% 63.5% 76.5% 69.5% 72.1% 63.8% 71.6% 85.2% FTICs 53.4% 64.3% 37.4% 49.6% 60.2% 60.1% 62.8% 43.5% 61.2% 73.1% AA-Trans. 77.6% 81.6% 41.3% 74.3% 82.8% 72.0% 80.6% 75.5% 82.1% 91.2% * Preliminary Data
Figure 11.Pass Rate for Teacher Certification 100.0% 90.0% 80.0% 70.0% 60.0% 50.0% 40.0% 30.0% 20.0% 10.0% 0.0% 1999-00 2000-01 2001-02 2002-03 Pass Rate 97.1% 96.8% 96.0% 96.9%
Figure 12. Pass Rate for Teacher CertificationUniversity Performance, 2002-03 100.0% 90.0% 80.0% 70.0% 60.0% 50.0% 40.0% 30.0% 20.0% 10.0% 0.0% UF FSU FAMU USF FAU UWF UCF FIU UNF FGCU SUS Pass Rate 96.1% 94.1% 76.7% 98.3% 99.6% 97.9% 100.0% 93.0% 97.1% 100.0% 96.9%
Figure 13.Baccalaureate Graduates Employed In FloridaPercentage Earning at Least $22,000One Year After Graduation 100.0% 90.0% 80.0% 70.0% 60.0% 50.0% 40.0% 30.0% 20.0% 10.0% 0.0% Fall 1999 Fall 2000 Fall 2001 Fall 2002 Fall 2003 Pct. $22,000 63.5% 67.5% 64.2% 62.4% 61.9% Standard 64.0% 64.0% Quarter Employed
Figure 14. Baccalaureate Graduates Employed In FloridaPercentage Earning at Least $22,000One Year After GraduationUniversity Performance, Fall 2003 100.0% 90.0% 80.0% 70.0% 60.0% 50.0% 40.0% 30.0% 20.0% 10.0% 0.0% UF FSU FAMU USF FAU UWF UCF FIU UNF FGCU NCF SUS Pct. $22,000 52.4% 58.8% 56.5% 69.2% 67.8% 48.7% 60.1% 68.3% 69.6% 76.0% 28.8% 61.9%
Figure 15.Baccalaureate Graduates Employed In FloridaPercentage Earning at Least $22,000Five Years After Graduation 100.0% 90.0% 80.0% 70.0% 60.0% 50.0% 40.0% 30.0% 20.0% 10.0% 0.0% Fall 1999 Fall 2000 Fall 2001 Fall 2002 Fall 2003 Pct. $22,000 85.0% 84.9% 85.6% 85.4% 84.9% Standard 90.0% 90.0% Quarter Employed
Figure 16. Baccalaureate Graduates Employed In FloridaPercentage Earning at Least $22,000Five Years After GraduationUniversity Performance, Fall 2003 100.0% 90.0% 80.0% 70.0% 60.0% 50.0% 40.0% 30.0% 20.0% 10.0% 0.0% UF FSU FAMU USF FAU UWF UCF FIU UNF FGCU SUS Pct. $22,000 84.8% 84.3% 84.3% 85.4% 85.6% 77.6% 83.7% 87.2% 86.0% 92.4% 84.9%
Figure 17.Percentage of Baccalaureate RecipientsEnrolled in (SUS) Graduate School 20.0% 15.0% 10.0% 5.0% 0.0% 1999-00 2000-01 2001-02 2002-03 2003-04 Pct. Graduate School 11.7% 11.8% 11.9% 12.5% 12.3% Standard 16.0% 16.0% 12.0% 12.0%
Figure 18. Percentage of Baccalaureate RecipientsEnrolled in (SUS) Graduate SchoolUniversity Performance, 2003-04 20.0% 15.0% 10.0% 5.0% 0.0% UF FSU FAMU USF FAU UWF UCF FIU UNF FGCU NCF SUS Pct. Grad 19.3% 10.9% 12.9% 9.5% 7.9% 10.5% 12.6% 10.7% 8.9% 10.8% 3.0% 12.3%
Figure 19.Percentage of Lower Level Instructional EffortProvided by Faculty 100.0% 90.0% 80.0% 70.0% 60.0% 50.0% 40.0% 30.0% 20.0% 10.0% 0.0% 1999-00 2000-01 2001-02 2002-03 2003-04 FacultyEffort 45.0% 45.2% 45.0% 43.8% 41.9% Standard 35.0% 35.0% 45.0% 45.0%
Figure 20. Percentage of Lower Level Instructional EffortProvided by FacultyUniversity Performance, 2003-04 100.0% 90.0% 80.0% 70.0% 60.0% 50.0% 40.0% 30.0% 20.0% 10.0% 0.0% UF FSU FAMU USF FAU UWF UCF FIU UNF FGCU NCF SUS FacultyEffort 31.2% 26.8% 70.4% 33.4% 39.5% 56.3% 56.0% 42.7% 59.1% 47.7% 91.5% 41.9%
Figure 21.Percentage of Upper Level Instructional EffortProvided by Faculty 100.0% 90.0% 80.0% 70.0% 60.0% 50.0% 40.0% 30.0% 20.0% 10.0% 0.0% 1999-00 2000-01 2001-02 2002-03 2003-04 FacultyEffort 66.2% 66.4% 66.9% 66.0% 65.5% Standard 50.0% 50.0% 66.0% 66.0%
Figure 22. Percentage of Upper Level Instructional EffortProvided by FacultyUniversity Performance, 2003-04 100.0% 90.0% 80.0% 70.0% 60.0% 50.0% 40.0% 30.0% 20.0% 10.0% 0.0% UF FSU FAMU USF FAU UWF UCF FIU UNF FGCU NCF SUS FacultyEffort 61.3% 59.4% 74.3% 62.6% 59.3% 72.8% 66.9% 68.6% 77.0% 77.8% 92.3% 65.5%
Figure 23.Percentage of Graduate Level Instructional EffortProvided by Faculty 100.0% 90.0% 80.0% 70.0% 60.0% 50.0% 40.0% 30.0% 20.0% 10.0% 0.0% 1999-00 2000-01 2001-02 2002-03 2003-04 FacultyEffort 77.6% 77.5% 78.3% 77.7% 76.8% Standard 55.0% 55.0% 73.0% 73.0%
Figure 24. Percentage of Graduate Level Instructional EffortProvided by FacultyUniversity Performance, 2003-04 100.0% 90.0% 80.0% 70.0% 60.0% 50.0% 40.0% 30.0% 20.0% 10.0% 0.0% UF FSU FAMU USF FAU UWF UCF FIU UNF FGCU NCF SUS FacultyEffort 75.1% 73.5% 82.6% 82.6% 68.2% 88.3% 72.8% 80.7% 85.2% 84.8% 0.0% 76.8% Note: New College of Florida (NCF) does not have graduate programs.
Figure 25.Percentage of Qualified Florida StudentsAdmitted as FTIC Students 98.0% 84.0% 70.0% 56.0% 42.0% 28.0% 14.0% 0.0% 1999-00 2000-01 2001-02 2002-03 2003-04 QualifiedStudents 94.6% 94.9% 94.8% 93.9% 91.9% Standard 95.0% 95.0% 95.0% 95.0%
Figure 26. Qualified Florida FTIC StudentsApplied, Admitted, and Enrolled 50,000 45,000 40,000 35,000 30,000 25,000 20,000 15,000 10,000 5,000 0 1999-00 2000-01 2001-02 2002-03 2003-04 Applied 34,042 37,414 38,411 42,482 45,439 Admitted 32,208 35,514 36,409 39,904 41,758 Enrolled 24,133 27,128 27,750 30,804 32,358
Figure 27.Percentage of Undergraduate StudentsClassified as Out-Of-State 100.0% 90.0% 80.0% 70.0% 60.0% 50.0% 40.0% 30.0% 20.0% 10.0% 0.0% 2001-02 2002-03 2003-04 % Out-of-State 8.6% 8.1% 7.5% Standard 10.0% 10.0% 10.0%
Figure 28.Percentage of UndergraduateStudents Classified as Out-of-State, 2003-04 100.0% 80.0% 60.0% 40.0% 20.0% 0.0% UF FSU FAMU USF FAU UWF UCF FIU UNF FGCU NCF SUS Percent 6.0% 10.3% 21.1% 4.5% 8.4% 9.8% 4.2% 8.9% 2.9% 6.4% 23.5% 7.5% Standard 10.0% 10.0% 10.0% 10.0% 10.0% 10.0% 10.0% 10.0% 10.0% 10.0% 10.0% 10.0%
Figure 29. Number of UndergraduateOut-of-State Students above 10%of all Undergraduate Students, 2003-04 1,600 1,400 1,200 1,000 800 600 400 200 0 UF FSU FAMU USF FAU UWF UCF FIU UNF FGCU NCF SUS Students 0 107 1,389 0 0 0 0 0 0 0 97 0 Standard 0 0 0 0 0 0 0 0 0 0 0 0
Figure 30.Percentage of Out-Of-State Students Admitted Who Do Not Meet State Admissions Standards 4.0% 3.0% 2.0% 1.0% 0.0% 2000-01 2001-02 2002-03 2003-04 Percentage 2.5% 3.1% 3.8% 2.1% Standard 0.0% 0.0% 0.0% 0.0%
Figure 31. Percentage of Out-Of-State Students Admitted Who Do Not Meet State Admission Standards, 2003-04 12.0% 10.0% 8.0% 6.0% 4.0% 2.0% 0.0% UF FSU FAMU USF FAU UWF UCF FIU UNF FGCU NCF SUS Percentage 0.5% 0.3% 9.8% 0.8% 4.0% 1.4% 1.2% 0.8% 5.5% 11.2% 4.3% 2.1%
Figure 32.Percentage of First-Time-In-College Students AdmittedWho are Profile Assessment 12.0% 10.0% 8.0% 6.0% 4.0% 2.0% 0.0% 2000-01 2001-02 2002-03 2003-04 Percentage 5.5% 8.1% 8.0% 5.3% Standard 10.0% 10.0% 10.0% 10.0%
Figure 33. Percentage of First-Time-In-College Students Admitted Who are Profile AssessmentUniversity Performance, 2003-04 30.0% 25.0% 20.0% 15.0% 10.0% 5.0% 0.0% UF FSU FAMU USF FAU UWF UCF FIU UNF FGCU NCF SUS Percentage 1.0% 0.4% 26.1% 1.9% 8.1% 5.9% 0.8% 2.7% 6.2% 8.0% 2.3% 5.3%
Figure 34.Profile Assessment StudentsWho are from Out of State 500 400 300 200 100 0 2000-01 2001-02 2002-03 2003-04 Students 338 455 384 301 Standard 363 363 363
Figure 35. Profile Assessment StudentsWho are from Out of StateUniversity Performance, 2003-04 200 150 100 50 0 UF FSU FAMU USF FAU UWF UCF FIU UNF FGCU NCF Students 22 10 178 12 23 0 33 7 0 11 5
Figure 36.Percentage of Profile Assessment StudentsWho are from Out of State 20.0% 15.0% 10.0% 5.0% 0.0% 2000-01 2001-02 2002-03 2003-04 Percentage 14.9% 15.6% 16.1% 14.1% Standard 10.0% 10.0% 10.0% 10.0%
Figure 37. Percentage of Profile Assessment StudentsWho are from Out of StateUniversity Performance, 2003-04 100.0% 80.0% 60.0% 40.0% 20.0% 0.0% UF FSU FAMU USF FAU UWF UCF FIU UNF FGCU NCF SUS Percentage 25.0% 16.7% 17.6% 6.4% 8.1% 0.0% 35.5% 5.2% 0.0% 14.9% 83.3% 14.1%
Figure 38.Baccalaureate Degrees Awarded 40,000 30,000 20,000 10,000 0 1999-00 2000-01 2001-02 2002-03 2003-04 Degrees 35,437 35,724 38,075 39,989 42,680 Standard 37,982 37,982 37,982 37,982
Figure 39. Baccalaureate Degrees AwardedUniversity Performance, 2003-04 8,000 6,000 4,000 2,000 0 UF FSU FAMU USF FAU UWF UCF FIU UNF FGCU NCF Degrees 8,574 6,578 1,604 5,459 3,900 1,481 7,189 4,861 2,226 667 141
Figure 40.Masters Degrees Awarded 14,000 12,000 10,000 8,000 6,000 4,000 2,000 0 1999-00 2000-01 2001-02 2002-03 2003-04 Degrees 10,036 10,766 11,622 12,179 13,040 Standard 11,008 11,008 11,008 11,008
Figure 41. Master’s Degrees AwardedUniversity Performance, 2003-04 3,500 3,000 2,500 2,000 1,500 1,000 500 0 UF FSU FAMU USF FAU UWF UCF FIU UNF FGCU Degrees 3,022 1,593 401 2,059 1,060 370 1,846 1,907 550 232
Figure 42.First Professional Degrees Awarded 1,400 1,200 1,000 800 600 400 200 0 1999-00 2000-01 2001-02 2002-03 2003-04 Degrees 1,237 1,245 1,335 1,380 1,370 Standard 1,170 1,170 1,170 1,170
Figure 43. First Professional Degrees AwardedUniversity Performance, 2003-04 1,000 800 600 400 200 0 UF FSU FAMU USF FAU UWF UCF FIU UNF FGCU Degrees 964 208 109 89 0 0 0 0 0 0
Figure 44.Doctorate Degrees Awarded 1,400 1,200 1,000 800 600 400 200 0 1999-00 2000-01 2001-02 2002-03 2003-04 Degrees 1,115 1,221 1,270 1,315 1,464 Standard 1,255 1,255 1,255 1,255
Figure 45. Doctorate Degrees AwardedUniversity Performance, 2003-04 700 600 500 400 300 200 100 0 UF FSU FAMU USF FAU UWF UCF FIU UNF FGCU Degrees 694 271 24 179 51 24 138 78 5 0
Figure 46.Externally Generated Research and Training Grant FundsPer State Funded Ranked Faculty Member $150,000 $125,000 $100,000 $75,000 $50,000 $25,000 $0 1999-00 2000-01 2001-02 2002-03 2003-04 Research/Faculty $97,196 $108,828 $120,455 $136,372 $149,299 Standard $97,196 $97,196 $97,196 $97,196
Figure 47.Externally Generated Research and Training Grant FundsPer State Funded Ranked Faculty MemberUniversity Performance, 2003-04 Thousands $22,5.0 $20,0.0 $17,5.0 $15,0.0 $12,5.0 $10,0.0 $7,5.0 $5,0.0 $2,5.0 $0.0 UF FSU FAMU USF FAU UWF UCF FIU UNF FGCU NCF SUS Research/Faculty $21,0.3 $13,7.9 $10,8.0 $21,2.6 $7,0.7 $9,4.6 $10,4.1 $10,0.4 $4,3.4 $5,3.5 $1,7.4 $14,9.3
Figure 48.Articles Published per Ranked Faculty 1.00 0.80 0.60 0.40 0.20 0.00 1998-99 1999-00 2000-01 2001-02 2002-03 2003-04 Articles 0.75 0.72 0.72 0.73 0.81 0.86 Standard 0.70 0.70 0.70
Figure 49. Articles Published per Ranked FacultyUniversity Performance, 2003-04 1.60 1.40 1.20 1.00 0.80 0.60 0.40 0.20 0.00 UF FSU FAMU USF FAU UWF UCF FIU UNF FGCU NCF SUS Articles 1.44 1.06 0.35 0.80 0.38 0.29 0.61 0.44 0.16 0.06 0.81 0.86
Figure 50.Percentage of IFAS Public Service ProjectsWhere Beneficiaries are Satisfied with Assistance 100.0% 90.0% 80.0% 70.0% 60.0% 50.0% 40.0% 30.0% 20.0% 10.0% 0.0% 1999-00 2000-01 2001-02 2002-03 2003-04 Satisfied 93.0% 98.0% 95.2% 98.4% 96.8% Standard 98.0% 98.0% 92.0% 92.0%