Download
1 / 42
420 likes | 589 Views
Phosphorus inputs to Lough Neagh. The increasing impact of agriculture. Introduction. This slide-show shows how phosphorus inputs to Lough Neagh have changed since 1974.

E N D
Phosphorus inputs to Lough Neagh.The increasing impact of agriculture
Introduction • This slide-show shows how phosphorus inputs to Lough Neagh have changed since 1974. • The data presented are based on monitoring of Lough Neagh and the inflowing rivers to Lough Neagh undertaken by the staff of AESD. • Comments should be addressed to Bob Foy(bob.foy@dardni.gov.uk)
Why does phosphorus create water quality problems? 1 Phosphates are non toxic - indeed they are vital for life. 2 That is the problem. Small amounts of phosphorus promote more plant life than a lake can cope with. 3 The phosphorus problem usually manifests itself by excessive amounts of algae. 4 Leading to decline in fish stocks, low oxygen levels, toxins, tastes and poor amenity value.
Eutrophication and phosphorus Eutrophication is the term used to describe the process of phosphorus enrichment.It can be defined as:The over-enrichment of lakes and rivers with nutrients, usually phosphorus, leading to excessive growth of algae and other aquatic plants.
How bad is the problem in lakes in Northern Ireland? Proposals for a strategy to control nutrient enrichment published by DOE (NI) 1999 stated that:Eutrophication is considered to pose the most widespread single threat to good water quality in Northern Ireland.
A standard for lake phosphorus • There is no legislative standard for phosphorus in lakes as there is for nitrates. • The classification system given in the OECD report of 1980, Eutrophication of Waters is widely used. • This defines lakes as eutrophic when annual lake P exceeds 35 mg P/l. • By this standard both Lough Neagh and Lough Erne are highly eutrophic
Is the problem getting worse? • Yes • Current trends over the past 10 years show a 50% increase in lake P in both Lough Erne and Lough Neagh.
Where does this phosphorus come from? Phosphorus principally originates from: 1 Towns 2 Septic tanks serving the rural population. 3 Industry - mostly creameries. 4 Agriculture - which is now the biggest single source to Lough Neagh and Lough Erne Rainfall is a very small (c1%) direct input to Lough Neagh and Lough Erne.
What is being done to reduce phosphorus coming from towns and industry? • Phosphorus reduction began in 1981 at major sewage treatment works in the Lough Neagh catchment. • It now removes about 100 tonnes P /yr. • Plant closures and a switch from P based cleaning agents has reduced the P load from industry.
Point source phosphorus loadingsLough Neagh catchment 1974-1997
What about detergents? • SOME detergents contain significant amounts of phosphorus. • Washing up liquids do not. • Dishwasher powders contain a lot of P. BUT • Since 1985 the amount of P used in these products has declined by 50%.
Septic tanks as a phosphorus source • If a septic tank discharges to a soakaway, it should lose little phosphorus to streams and rivers. • BUT many tanks discharge to drains etc. • Best “guesstimate” is that 60% of septic tank discharges reach surface waters.
Diffuse river loading and septic tank phosphorus loadings Lough Neagh catchment 1974 vs1997
Septic tanks as a driver of change? It is unlikely that septic tanks are the cause of change seen in Loughs Neagh and Erne given the: • modest increase in rural population and • the decline in detergent P usage, .
Since 1974 annual losses of phosphorus to Lough Neagh from diffuse sources have increased by 143 tonnes P Equivalent to • A rural population increase of 274,000 or • An urban population increase of 165,000. Actual changes • The rural population increased by 14,000. and a • P reduction from towns equivalent to an urban population decrease of 102,000
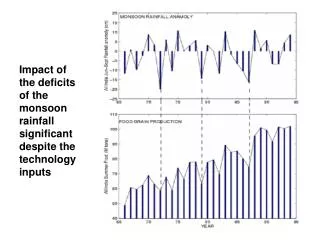
Are agricultural phosphorus losses increasing? • Yes - Since 1974, there has been a steady increase in agricultural P losses. • This increase has been more than enough to cancel out the benefits of reducing P from other sources. • Annual P losses are highly related to river flow. Losses are much higher in winter than in summer.
Soluble phosphates from diffuse sources & river flows:Lough Neagh rivers 1974-1997
What causes agricultural phosphorus losses? Is it farm-yards? • Dirty water from farm-yards, leaking tanks etc are the most visible form of P losses. • Results from the Colebrooke catchment suggest they may contribute 15-20% of P losses. • It is unlikely that P losses from farm-yards are increasing. Farm pollution incidents are down since 1987.
Could it be manures then? • Land spreading of manures will lead to P losses to water if the ground is wet or spreading is followed by rainfall and drain-flow. • Manure P produced in the Neagh catchment has increased by only 25% since 1974. • This is a smaller increase compared to the diffuse P increase measured in rivers.
Manure P and diffuse phosphate loadsLough Neagh catchment 1975-1998
Fertilisers?? • Fertilisers are spread in spring and summer when runoff and diffuse P losses are small. • The direct impact of fertiliser P applications on P in lakes and rivers is likely to be small. • There has been no real increase in fertiliser P use since 1974 (or since the 1940s).
So fertilisers aren’t a problem? • Except that NI Agriculture imports a large amount of P in animal feed-stuffs - referred to as “concentrate P”. • Combined with fertiliser P, inputs of P to agriculture exceed outputs in crops, meat, milk products and wool. • This means agriculture operates a P surplus.
Is it the phosphorus surplus? • As inputs have consistently exceeded outputs of P in farm production, there has been a P surplus. • The P surplus has remained fairly constant since 1974. • Almost all of this P surplus accumulates in the soil.
Surplus phosphorus and fertiliser phosphorus • The annual P surplus in Northern Ireland agriculture is roughly equal to annual P fertiliser use. • Changes in the P fertiliser use are clearly reflected in the P surplus for Northern Ireland agriculture.
Phosphorus surplus & fertiliser trends Northern Ireland agriculture: 1974-98
Surplus phosphorus and soil phosphorus • A long-term effect of this surplus is an increase in soil P levels in Northern Ireland soils since the 1940s. • Soil P can now be classed as at “excess” levels on more than 40% of soils. • Grass grown on soils which have “excess” P will not respond to more P added either as fertiliser or manure P.
Increasing soil P - Is it a phosphorus “time-bomb”? • The sustained annual P surplus is resulting in an increase in soil P. • This increase is related statistically to the increase in soluble P from diffuse sources measured in the Lough Neagh rivers. • The P surplus could be reduced by cutting back on fertiliser P use on high P soils.
Since 1974 soils in the Lough Neagh catchment have accumulated a surplus 76,000 tonnes of phosphorus. Annual phosphate losses to Lough Neagh from agriculture have increased by 143 tonnes P. This is represents 0.2% of the accumulating phosphorus. Assuming that soil phosphorus cannot move from soil to water may only be 99.8% true.
So we can forget about manures then? - No! • Halting the P surplus may only stop the situation getting worse. • Tackling manure P losses will be crucial in achieving significant improvements.
So we can forget about manures then? • P losses from a field drain at Greenmount show annual P losses varying at least ten-fold • High P losses were caused by slurry applications followed by high drain-flows. • The highest single manure P application was during a dry summer. • It produced the lowest annual P loss.
What can we learn? • There is no prospect for improving water quality unless P losses from agriculture are substantially reduced. • P use in agriculture must be critically reviewed - as many farms now have fields with high soil P levels. • This review is best done in the context of nutrient management planning - when crop requirements for all nutrients are assessed - a field that is rich in soil P may not be rich in potash or sulphur. • The plant nutrient value of manures must be better recognised and utilised on farms. • The storage, containment and spreading of manures must be improved if river P loads are to decline.