Download
1 / 54
540 likes | 650 Views
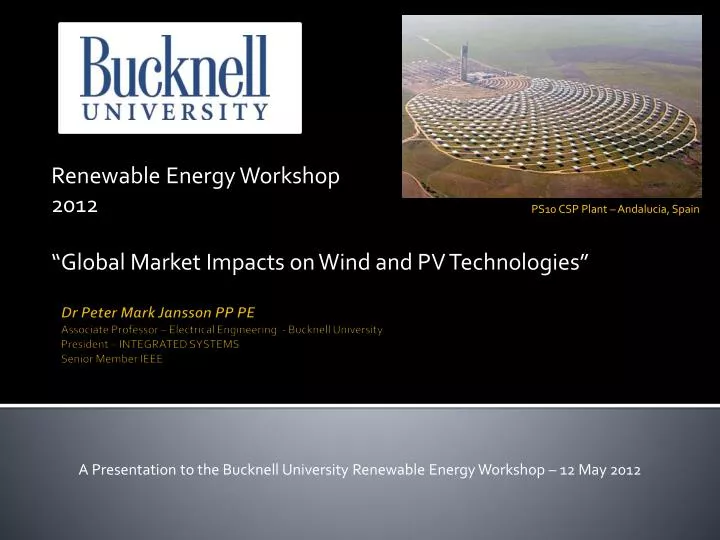
Renewable Energy Workshop 2012 “Global Market Impacts on Wind and PV Technologies”. PS10 CSP Plant – Andalucia , Spain. Dr Peter Mark Jansson PP PE Associate Professor – Electrical Engineering - Bucknell University President – INTEGRATED SYSTEMS Senior Member IEEE.

E N D
Renewable Energy Workshop 2012 “Global Market Impacts on Wind and PV Technologies” PS10 CSP Plant – Andalucia, Spain Dr Peter Mark Jansson PP PEAssociate Professor – Electrical Engineering - Bucknell UniversityPresident – INTEGRATED SYSTEMSSenior Member IEEE A Presentation to the Bucknell University Renewable Energy Workshop – 12 May 2012
Aims • Review two renewable energy technologies • current market drivers • Technology, economics, electricity demand, environmental concerns, modularity and construction ease, government policy • Resulting Market Trends • US and Global • Impact on Renewable Costs and Electricity Prices
Market Drivers of Renewable Growth • 1) Growing Global Energy/Electrical Demand • 2) Technology Experience and R&D • 3) Increasing Cost Competitiveness • 4) Growing Environmental Concerns • 5) Governmental Policy Initiatives • Tax Credits, Feed-in Tariffs, RPS and RECs • 6) Rapid/Modular/Ease of Construction
Market Drivers of Renewable Growth • 1) Growing Global Energy/Electrical Demand • 2) Technology Experience and R&D • 3) Increasing Cost Competitiveness • 4) Growing Environmental Concerns • 5) Governmental Policy Initiatives • Tax Credits, Feed-in Tariffs, RPS and RECs • 6) Rapid/Modular/Ease of Construction
Sources of Energy - US CO2 Emissions (millions of metric tons . and per quad) Petroleum: 2598, 64.0 Natural Gas: 1198, 53.0Coal: 2115, 92.3 About 86% Fossil Fuels 1 Quad = 293 billion kWh (actual) 1 Quad = 98 billion kWh (used, taking into account efficiency) Source: EIA Energy Outlook 2009 (Early Release), Table 1, 2008 Data
US Electricity Sources (‘07 & ‘09) US EIA - 2009 US EIA - 2007 Source: http://www.eia.gov/cneaf/electricity/epa/figes1.html
Global & US Trends Nuclear • Prime Movers (World Electricity 1998,2005,2008 & US 2009) • Fossil Fuel (Thermal) powered – 62.8% 66.0% 67.8% 69.1% • Nuclear fission – 16.9% 15.2% 13.5% 20.2% • Hydro powered – 18.8% 16.7% 15.9% 6.8% • Renewables & Other** – 1.5% 2.1% 2.8% 3.9% • ** - ‘Other’ includes geothermal, wood, solar and biomass Hydro Fossil Source: USDOE - EIA and IEA.org
Historical and Projected US Energy Consumption Energyin Quads Data says we will be 81% Fossil in 2035!! Source: EIA Annual Energy Outlook, 2010
The World: Top Energy Users (in Quad), 2006 Data World total is 472; Average per 100 Million people is about 7.32. If world used US averagetotal consumption would be about 2148 quad! • USA – 99.9 • China – 73.8 • Russia – 30.4 • Japan – 22.8 • India – 17.7 • Germany – 14.6 • Canada – 14.0 • France – 11.4 • UK – 9.8 • Brazil – 9.6 Source: US DOE EIA
Market Drivers of Renewable Growth • 1) Growing Global Energy/Electrical Demand • 2) Technology Experience and R&D • 3) Increasing Cost Competitiveness • 4) Growing Environmental Concerns • 5) Governmental Policy Initiatives • Tax Credits, Feed-in Tariffs, RPS and RECs • 6) Rapid/Modular/Ease of Construction
PV Cell Research SOURCE: S.Kurtz, “Opportunities and Challenges for Development of a Mature Concentrating Photovltaic Power Industry”, NREL Technical Report Feb 2009
Photovoltaics • Historic Market Growth • Technology improvement • Near mass production in China
Historical PV Data (Cost v. Market) SOURCE: U.K.W. Schwabe MSE Thesis 2011 Rowan University
Global PV Market Growth 2010 – 143% 2011 – 31.8% 2005-2011 CAGR – 61.5% SOURCE: Schwabe and Jansson
PV Industry Experience Curve > 62 GW <$0.95/ W SOURCE: U.K.W. Schwabe MSE Thesis 2011 Rowan University
Market Drivers of Renewable Growth • 1) Growing Global Energy/Electrical Demand • 2) Technology Experience and R&D • 3) Increasing Cost Competitiveness • 4) Growing Environmental Concerns • 5) Governmental Policy Initiatives • Tax Credits, Feed-in Tariffs, RPS and RECs • 6) Rapid/Modular/Ease of Construction
Cost of PV Electricity SOURCE: U.K.W. Schwabe MSE Thesis 2011 Rowan University
2012 - $0.9/w module - $3.5o/w systems 2012 SOURCES: Prometheus Institute, INTEGRATED SYSTEMS , RAI Services, Inc.
Cost of PV Electricity 2011 USDoL NY/NJ Average: 20.2 ¢ /kWh ---------------------------- Moving Toward Grid Parity EIA - NJ All Sector Weighted Average: 14.84 ¢ /kWh --------------------------------------------- 2012 EIA – PA Residential Average: 12.6 ¢ /kWh --------------------------------------------- SOURCES: U.K.W. Schwabe, INTEGRATED SYSTEMS
Ball park Energy Costs Source: http://www.oe.energy.gov/DocumentsandMedia/adequacy_report_01-09-09.pdf
Historical Change in Renewable Economics, Constant 2005 Dollars Source: National RenewableEnergy Lab (NREL), Energy Analysis Office
Renewable Costs SOURCE: Renewables 2011 – Global Status Report
Renewable Costs SOURCE: Renewables 2011 – Global Status Report
Renewable Costs SOURCE: Renewables 2011 – Global Status Report
Current Market Trends? • Global Hydro Capacity • Continues to increase • Large projects less so than small projects • Wind • Most rapidly expanding in terms of capacity • Solar Photovoltaics (PV) • Most rapidly expanding in terms of growth rate
Global Wind & PV Markets (1994-present) SOURCE: Jansson 2012
Wind and PV vs. World Electric Capacity World Annual Generation Changes New • YearΔGrowthWind & PV% • 2008 +157 GW 33 GW 21 % • 2009 +127 GW 46 GW 36 % • 2010 +157 GW 54 GW 34% • 2011 +61 GW 65 GW 106%
World Market Update: 1st Quarter 2012 • World Wind demand is again expected to be higher than 2011 demand • US market growth of 1,695MW (new wind) projects is 52% higher than 2011 Quarter 1* • World Photovoltaic demand is also expected to exceed 2011 performance • Q1'12 global PV demand is now forecast at 6.9 GW, down 35% Q/Q, but up a huge 146% Y/Y** • SOURCES: • * - American Wind Energy Association - http://www.awea.org/learnabout/industry_stats/index.cfm • * * - Solarbuzz - http://solarbuzz.com/our-research/recent-findings/expectations-policy-adjustments-germany-drive-global-pv-demand-146-yy-q
Levelized Cost of Electricity • Cents per kWh • MinMax2012* • Wind Costs (2009) 8.4 14.2 5-13 • PV Costs (2009) 13.2 29.8 7-18 • * - Does not include 30% Federal Tax Credit, depends on local resource 2009 Data Source: http://www.epa.gov/cleanenergy/documents/renewables_cost_data.xls
Capital Investment for New Generation • Wind • $1.5 - $2.00 / Watt • PV • $2 – $3.50 / Watt • Coal • $3-$3.50 / Watt • Gas • $1-$1.50 / Watt • Nuclear • $4-6.50 / Watt SOURCE: http://www.ewea.org/index.php?id=1639 SOURCE: http://www.anga.us/issues--policy/power-generation/clean--efficient
State Variation in Electric Rates The U.S average residential retail price of electricity was 11.53 cents per kWh in 2010 SOURCE: http://www.electricchoice.com/electricity-prices-by-state.php
Recent NY/NJ Retail Prices SOURCE: U.S. Dept. of Labor – BLS –News Release 30 Nov 2011
Market Drivers of Renewable Growth • 1) Growing Global Energy/Electrical Demand • 2) Technology Experience and R&D • 3) Increasing Cost Competitiveness • 4) Growing Environmental Concerns • 5) Governmental Policy Initiatives • Tax Credits, Feed-in Tariffs, RPS and RECs • 6) Rapid/Modular/Ease of Construction
Carbon Neutrality of Renewables Climate Change is… SOURCE: 2011 Gallup Poll
Why Renewables? You are Here 396 ppm
April 2012: 396.18 ppmApril 2011: 393.28 ppm Next year over 400 ppm !
U.S Annual Average Temperature Source: http://www.noaanews.noaa.gov/stories2009/images/1208natltemp.png
Market Drivers of Renewable Growth • 1) Growing Global Energy/Electrical Demand • 2) Technology Experience and R&D • 3) Increasing Cost Competitiveness • 4) Growing Environmental Concerns • 5) Governmental Policy Initiatives • Tax Credits, Feed-in Tariffs, RPS and RECs • 6) Rapid/Modular/Ease of Construction
Federal RE Tax Credits • Homeowners and Businesses • 30% Renewable Energy Investment Tax Credit • Businesses and Investors • Accelerated Depreciation
Renewable Portfolio Standards 30 States with min. standards 7 States with voluntary goals SOURCE: http://205.254.135.7/todayinenergy/detail.cfm?id=4850
Renewable Portfolio Standards WA: 15% by 2020* ME: 30% by 2000 New RE: 10% by 2017 VT: (1) RE meets any increase in retail sales by 2012; (2) 20% RE & CHP by 2017 MN: 25% by 2025 (Xcel: 30% by 2020) MT: 15% by 2015 • NH: 23.8% by 2025 ND: 10% by 2015 MI: 10% + 1,100 MW by 2015* • MA: 15% by 2020+1% annual increase(Class I Renewables) • OR: 25% by 2025(large utilities)* 5% - 10% by 2025 (smaller utilities) SD: 10% by 2015 WI: Varies by utility; 10% by 2015 goal • NY: 24% by 2013 RI: 16% by 2020 CT: 23% by 2020 • NV: 25% by 2025* IA: 105 MW • OH: 25% by 2025† • CO: 20% by 2020(IOUs) 10% by 2020 (co-ops & large munis)* • PA: 18% by 2020† • IL: 25% by 2025 VA: 15% by 2025* • NJ: 22.5% by 2021 CA: 20% by 2010 UT: 20% by 2025* KS: 20% by 2020 • MD: 20% by 2022 • MO: 15% by 2021 • AZ: 15% by 2025 • DE: 20% by 2019* • NC: 12.5% by 2021(IOUs) 10% by 2018 (co-ops & munis) • DC: 20% by 2020 • NM: 20% by 2020(IOUs) • 10% by 2020 (co-ops) TX: 5,880 MW by 2015 30 states & DChave an RPS 7 states have goals HI: 40% by 2030 State renewable portfolio standard Minimum solar or customer-sited requirement * State renewable portfolio goal Extra credit for solar or customer-sited renewables † Solar water heating eligible Includes separate tier of non-renewable alternative resources Source: http://www.dsireusa.org/
Solar Renewable Energy Credits SOURCE: http://srectrade.com/srec_prices.php
Pennsylvania SREC History • SOURCE: http://srectrade.com/pennsylvania_srec.php Time Period SREC Value Autumn 2009 – December 2010 $250-$300 / MWhr January 2011 – March 2011 $176 -$250 / MWhr April 2011 $ 100 / MWhr May-June 2011 $ 80 / MWhr July 2011 $ 50 / MWhr August 2011 $ 25 / MWhr Sep-December 2011 $ 10-20 / MWhr January 2012 $ 20-30 / MWhr February 2012 $ 10-35 / MWhr March 2012 $ 10-20 / MWhr April 2012 $ 20 / MWhr