routing
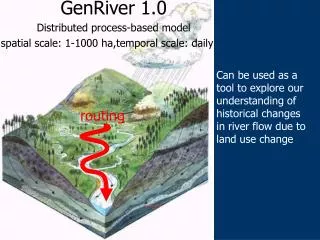
GenRiver 1.0 Distributed process-based model spatial scale: 1-1000 ha,temporal scale: daily. routing. Can be used as a tool to explore our understanding of historical changes in river flow due to land use change. Hydrological functions of forest:. cloud interception. Landscape drainage.

routing
E N D
Presentation Transcript
GenRiver 1.0 Distributed process-based model spatial scale: 1-1000 ha,temporal scale: daily routing Can be used as a tool to explore our understanding of historical changes in river flow due to land use change
Hydrological functions of forest: cloud interception Landscape drainage ? rainfall canopy water evaporation Forest transpiration surface evaporation Trees through-fall surface run-on stem-flow { Quick flow infiltration surface run-off recharge sub-surfacelateral inflow Soil lateral outflow uptake base flow percolation
‘Permanent’ site characteristics Upland land use Quantity, timing, quality of river flow Watershedfunctions poverty poverty poverty Riverbed engineering Downstream water users & stakeholders Spatial planning PES Regulation poverty Adequate supply of clean water, no flooding
Watershedfunctions Site cha- racteristics Relevant for • Rainfall • Land form • Soil type • Rooting depth (natural vegetation) 1. Transmit water 2. Buffer peak rain events 3. Release gradually 4. Maintain quality 5. Reduce mass wasting • Downstream water users, • esp. living in floodplains & river beds, • esp. without storage • or purification • at foot of slope
GenRiver 1.0 a simple model that translates a plot-level water balance to landscape level river flow Land cover influences: * evapotranspiration -> water yield (immediate) * infiltration (medium term ~ soil type)
Unit hydrograph – what happens to an ‘average’ drop of rainfall? 1. Interception & evaporation from wet surfaces 1 4 2. Overland flow into streams: quickflow 3. Subsurface flow into streams: ‘interflow’ or ‘soilquickflow’ 2 4. Uptake by plants for transpiration (+ soil evaporation) 3 5 5. Gradual release to streams through deep soil pathways
The core of the model : Patch level represent daily water balance, driven by local rain rainfall and modified by land cover and soil properties of the patch
The patch can contribute to three types of stream flow : • Surface quick flow – on the day of rain event • Soil quick flow – on the next day after rain event • Base flow – via gradual release of groundwater
Unit hydrograph – what happens to an ‘average’ drop of rainfall? 1. Interception & evaporation from wet surfaces 1 4 2. Overland flow into streams: quickflow 3. Subsurface flow into streams: ‘interflow’ or ‘soilquickflow’ 2 4. Uptake by plants for transpiration (+ soil evaporation) 3 5 5. Gradual release to streams through deep soil pathways
1:1 Water storage on leaf sur- faces, mm Throughfall probability Capacity limited Rainfall per event, mm Step 1 – canopy interception 1. Interception & evaporation from wet surfaces 1 Current LAI Waterfilm thickness =Cap*(1-EXP(-Rain/Cap)) Will evaporate within a day Calder (2004) HYLUC
Step 2 – Lack of Infiltration => overland flow • Two conditions lead to overland flow: • Surface infiltrability less than required during storm (‘Hortonian’ overland flow, ‘sealing’ of the surface’); 1 2 • slope, surface roughness and rainfall intensity determine the time available for infiltration • Saturation-limited: surface soil layers are saturated and rate of outflow determines possible rate of inflow 1. Interception & evaporation from wet surfaces 2. Overland flow into streams: quickflow PotInfRate Rain duration, Can.Interc.Delay Surface staorage, Slope SoilSat - Actual
1 2 3 Step 3 – Soil quickflow: drain towards ‘field capacity’ 1. Interception & evaporation from wet surfaces 2. Overland flow into streams: quickflow 3. Subsurface flow into streams: ‘interflow’ or ‘soilquickflow’ ‘Two-tank model’ RootZone store Saturation FC Percolation Fraction SoilQuickFlow: Max(0,Soil- FieldCap) GW store Saturation GW release Fraction Baseflow
1 4 2 3 1.0 FC*DroughtFactor(VegType) 0 PWP Soil water content Step 4 – Plant uptake and transpitation 1. Interception & evaporation from wet surfaces 2. Overland flow into streams: quickflow 3. Subsurface flow into streams: ‘interflow’ or ‘soilquickflow’ 4. Uptake by plants for transpiration (+ soil evaporation) (Epot – IntercEff * Einterc) * W_avail Evaporation of intercepted water reduces transp. demand Energy driven, e.g.Penman
Step 5 – Percolation to streams as ‘slow flow’ 1. Interception & evaporation from wet surfaces 2. Overland flow into streams: quickflow 3. Subsurface flow into streams: ‘interflow’ or ‘soilquickflow’ 1 4 4. Uptake by plants for trans-piration (+ soil evaporation) 5. Gradual release to streams through deep soil pathways 2 3 RootZone store 5 Percolation Fraction GW store Saturation GW release Fraction Baseflow
Unit hydrograph – what happens to an ‘average’ drop of rainfall? 1. Interception & evaporation from wet surfaces 1 4 2. Overland flow into streams: quickflow 3. Subsurface flow into streams: ‘interflow’ or ‘soilquickflow’ 2 4. Uptake by plants for transpiration (+ soil evaporation) 3 5 5. Gradual release to streams through deep soil pathways
Topology of stream network: distances to array of observation points A B Obs point 1 2 3 4 5 SubA 15 -1 -1 7 . SubB 16 -1 -1 8 . SubC 14 8 2 -1 . SubD 8 1 -1 -1 . ….. C 3 D 4 E 2 F G 1
Model implementation in Excel • GenRiver.xls : • Rain & Debit data (daily) • Land cover • Subcatchment info
Model implementation in Stella GenRiver.stm Model sector
Model implementation in Stella GenRiver.stm GenRiver.stm Input section
Model implementation in Stella GenRiver.stm GenRiver.stm Patch level water balance
Model implementation in Stella GenRiver.stm GenRiver.stm River flow
measured predicted Default run of GenRiver 1.0
measured predicted When seen over a long time series, both under- and over-estimates occur in dry periods, but the model tends to exaggerate peaks
measured predicted The model is in the ‘right range’ but underestimates flows in dry periods and exaggerates peaks
Model implementation in Stella GenRiver.stm GenRiver.stm Output sector
GenRiver application in Sumberjaya - Indonesia Explore the effect of land cover & spatial pattern for rainfall on river flow Using 2 time series of land cover fractions : Year 3(%) Year 20(%) Forest 58 14 Cropland 22 11 Coffee 12 70
Patchy year 3 Patchy year 20 Hm year 20 Hm year 3 River flow using Pathcy & Homogenous rain
Climate, soil, scale, land use Participants Expectations? Criteria & indicators of watershed functions Output - hydrographs Input data GenRiver.stm WShedInd.xls SpatRain.xls SpatRain.exe What we offer
Simulation results: current ‘MixedLU’ situation not much different from ‘forest’, but for a ‘Degraded soil’ buffering would be much less Homogenous rain Patchy rain Degraded soil Degraded soil current current