Download
1 / 23
230 likes | 344 Views
Explore coincidence analyses in gravitational wave experiments, addressing detector sensitivities, event energies, noise, and solutions like signal-to-noise ratios.

E N D
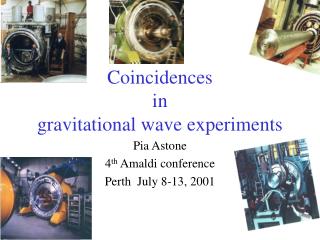
Coincidences in gravitational wave experiments Pia Astone 4th Amaldi conference Perth July 8-13, 2001
Main coincidence analyses we have done in the past: Allegro-Explorer : Jun-Dec 1991 (180 days) Phys. Rev D 59, 1999 Explorer-Nautilus-Niobe : Dec 1994-Oct 1996 (Explorer –Nautilus: 57 days . Explorer-Niobe: 56 days) Astrop. Phys. 10, 1999 IGEC 1997-1998 Phys. Rev. Letters,85,2000 The IGEC analysis of the data 1997-2000 is now being done
Some basics figures of the coincidence analysis • We exchange events, above given thresholds (depending on the detector sensitivitiesvarying with the time) • Each group applies vetoing procedures, to the noise and/or to the events, before the analysis is done • The analysis procedure is based on “the time shift procedure” (see-e.g.-Int. Journal of Modern Physics D,9,2000)
Main problems • The sensitivity of each detector varies with time • The sensitivities of the various detectors are different • The same signal generates events with energies different for each detector • The choice of the coincidence window
The detector sensitivities may be very different.. and thus different signals could be detected 3 10-18 Noise of Explorer And Nautilus in 1998 The y-axis expresses the sensitivity to burst 0.5 10-18 Days from 1 Jan 1997 Days from 1 Jan 1997
and also the event energies may be different, Explorer - Nautilus 1996 Astrop. Phys., 10, 1999 Days from 1 Jan 1994
What is the solution ? First of all: it should be clear the difference SIGNALS-EVENTS
Signals and events Differential probability SNR=signal to noise ratio of the signal (here: 10, 20, 50) The x-axis gives the signal to noise ratio of the event The y-axis gives the differential probability for the SNR of the event Event SNR
Probability of detection Probability of detection Note that this effect does not depend on the detector bandwidth SNR=signal to noise ratio of the signal (here: 10, 20, 50) The x-axis gives the signal to noise ratio of the threshold The y-axis gives the probability of detection for a given SNR-t SNR of the threshold
Simulation of the efficiency of detection: delta-like signals applied to the Explorer data, with various SNRs Astone,D’Antonio,Pizzella PRD 62 (2000)
Simulation of the efficiency of detection: delta-like signals applied to the Explorer data, with various SNRs Astone,D’Antonio,Pizzella PRD 62 (2000)
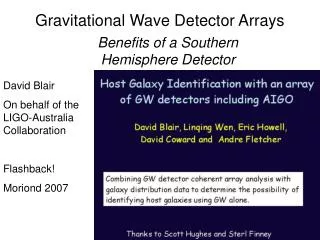
The analysis procedure:a new selection algorithm based on the event energies CQG, 18 (2001) • Now we know that, for given SNR_s of the signal, there is a chance of obtaining certain SNR_e of the event • We assume various signal values (h=10^-18-10^-17) • For each h we evaluate SNR_s (different for each detector and for each event-it is a function of the local noise) • We accept an event, and thus a coincidence, if the SNR_s - 1 std <SNR_e<SNR_s + 1 std Based on an original observation of D. Blair et al.: the distribution of energy ratios of the event energies of two detectors is different for real and accidental coincidences (if non-gaussian noise) Journal of General Relativity and Gravitation (2000)
Explorer and Nautilus 1998 IGEC data Bursts sensitivity h (SNR=1) : Ex= 1.6 10-18 NA= 1.1 10-18
We have applied this algorithm to the Explorer and Nautilus 1998 IGEC data The use of the energy selection algorithm has reduced the number of accidental coincidences by a factor of 4 No select Energy select
Another selection criterium: based on the detector orientation with respect to specific sources, e.g. GC • Since no extragalactic signals are expected, with the present sensitivity, we can select the events according to the orientation of the detectors, with respect to the GC S=So (sinq)4 This criterium has been applied in CQG,18 (2001)
Based on the same idea, we are now testing a new procedure: coincidences (real or shifted) are weighted according to the value of sin(teta)4 for given directions (M. Visco) Experimental probability The plot represents, for each direction, the experimental probability that the result for real (zero delay) coincidences is due to noise Decl Right ascension
A new procedure for evaluation of upper limits (Astone,Pizzella: Astrop. Physics, in press 2001) • The procedure used in the past (e.g. Allegro-Explorer 1991, IGEC 1997-1998 ) is described in Amaldi et al, A&A, 216 (1989) Problems Signals-events The energy of the event is not the energy of the GW Efficiency of detection It is smaller than unity, and this changes the upper limit
ON times for the various detectors 1997-2001 200 d 221 d 852 d 553 d 659 d
ON times for the 1997-2000 coincidence analysis 2 detectors=714 days 3 detectors=179 days 4 detectors=30 d 3 detectors=149 d 2 detectors=535 d 1 detector=609 d 0 detectors=137 d
We have applied the GC algorithm to the Explorer and Nautilus 1998 IGEC data All Energy GC
Time deviation and the problem of the coincidence window • We have found that, for signals syncronized with the sampling time, the statistical time uncertainty is expressed by s = 1/(2 p Df) sqrt(2/SNR) This suggests to use a variable coincidence window (R. Terenzi)
Simulation of the efficiency of detection and time deviation: delta-like signals applied to the Explorer data, with various SNRs