Download
1 / 1
10 likes | 109 Views
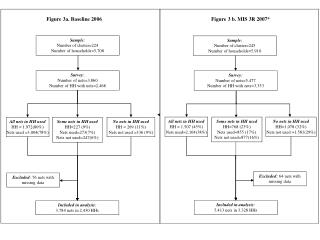
Figure 3a. Baseline 2006. Figure 3 b. MIS 3R 2007*. Sample: Number of cluster=224 Number of households=5,708. Sample: Number of cluster=245 Number of households=5,910. Survey: Number of nets=3,860 Number of HH with nets=2,468. Survey: Number of nets=5,477 Number of HH with nets=3,353.

E N D
Figure 3a. Baseline 2006 Figure 3 b. MIS 3R 2007* Sample: Number of cluster=224 Number of households=5,708 Sample: Number of cluster=245 Number of households=5,910 Survey: Number of nets=3,860 Number of HH with nets=2,468 Survey: Number of nets=5,477 Number of HH with nets=3,353 All nets in HH used HH = 1,507 (45%) Nets used=2,164(38%) Some nets in HH used HH=768 (23%) Nets used=855 (17%) Nets not used=877(16%) No nets in HH used HH=1,078 (32%) Nets not used =1,581(29%) All nets in HH used HH = 1,972(80%) Nets used =3,004(78%) Some nets in HH used HH=227 (9%) Nets used=273(7%) Nets not used=247(6%) No nets in HH used HH = 269 (11%) Nets not used =336 (9%) Excluded: 64 nets with missing data Excluded: 76 nets with missing data Included in analysis: 5,413 nets in 3,328 HHs Included in analysis: 3,784 nets in 2,430 HHs