Download
1 / 19
200 likes | 388 Views
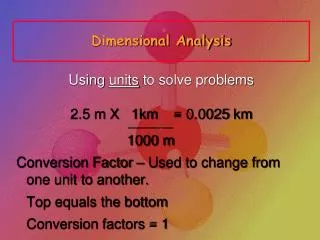
MN-B-C 2 Analysis of High Dimensional (-omics) Data. Week 5: Proteomics 1. Kay Hofmann – Protein Evolution Group http://www.genetik.uni-koeln.de/groups/Hofmann. Proteomics - what is it good for ?. Detection Proteomics Which proteins are there? Which are abundant?

E N D
MN-B-C 2 Analysis of High Dimensional (-omics) Data Week 5: Proteomics 1 Kay Hofmann – Protein Evolution Grouphttp://www.genetik.uni-koeln.de/groups/Hofmann
Proteomics- whatisitgoodfor? Detection Proteomics • Which proteins are there? Which are abundant? • Which part of a protein is there? • Are there changes in protein presence or abundance? Modification Proteomics • Which proteins have posttranslational modifications? • What fraction of a protein pool is modified? • Are there changes in protein modification level? Interaction Proteomics • Which bind to each other or form complexes? • What fraction of a protein pool is bound/complexed? • Are there changes in protein interaction patterns?
Major methodsforproteindetection Two-dimensional gel electrophoresis • Detektion (and possibly quantification) of entire proteins. • limited scope, lack of reproducibility • old school Mass spectrometry • Possibly coupled with liquid chromatography (LC) • Detection (and possibly quantification) of peptides • Requires sophisticated instrumentation Antibodies • Candidate proteins have to be known • Specific antibodies have to be available • only suitable for small- and medium-scale studies Specific protein tags • Candidate proteins have to be known and be modified artificially • only suitable for special applications
Two-dimensional gelelectrophoresis 1st Dimension Isoelectric focussing Separation by isoelectric point Modification 2nd Dimension SDS PAGE Separation by size
Two-dimensional gelelectrophoresis Differences in Gel properties can be (partially) compensated Protein Recognition Can to (some degrees) be done directly on gel by a combination of IEP/MW-values and recognition of spot patterns. Usually, MS analysis of eluted spots required.
Coverageof a good MS analysis • How many proteins can be detected ? • In a 4 h run on the newest generation instrument: • 25.000 peptides • 4.000 proteins • Sample requirement • 4 µg peptide sample • Sample preparation time • 6h plus digest time
Fragmentationpattern H+ x3 y3 z3 x2 y2 z2 x1 y1 z1 R1 O R2 O R3 O R4 O H – N – C – C – N – C – C – N – C – C – N – C – C – OH H H H H H H H H a1 b1 c1 a2 b2 c2 a3 b3 c3 a,b,c ions: charge retained in N-terminal fragment x,y,z ions: charge retained in C-terminal fragment The type of generated ion depends on the MS method
Identificationby 'sequence tags' • In principle, the fragmentation pattern of a peptide could result in a complete series of (e.g.) b-ions that allows the determination of the peptide sequence. • Real data typically allows only identification of 3mer or 4mer peptides. GWSV K/R K/R 1489.430 650.213 Short tags can identify a peptide if combined with additional data (size) This method can tolerate some degree of modification or variability, even if this is unknown/unexpected. Identification of suitable tags is difficult, often done manually
Identificationbycomparisonwithprecalculatedspectra • The entire fragment spectrum of a peptide is compared to a database of expected spectra for every possible peptide. • Possible peptides are taken from a proteome-wide sequence database, taking the cleaving enyzme into account. • Even if some ions are missing or too much, the correcpt peptide can be identified by a good correlation of expected and observed pattern. • Problems with polymorphisms, modifications, other unexpected things.
Does a pre-separationofproteinsmake sense ? Nowadays rarely done • Can introduce bias • Protein separation is often not very reproducible • Reduces sample/spectrum complexity • Spectra contain data of fewer proteins. But: more spectra have to be measured • Allows quantification at protein level • Protein amounts (e.g. LC peaks) more quantitative than peptide amounts or even MS peaks. Allows the detection of minor components Minor proteins are not overwhelmed by peptids from major components
ExampleoutputofMascot (Protein Level) missedcleavagesite matchesthisprotein, but also anotherone (withbetter score)
ExampleoutputofMascot (Ion Level) b* = b without NH3 b0 = b without H2O b++ = b withtwocharges
Quantitative MS Proteomics • Mass Spectrometry is not a quantitative method • Different ions have different physicochemical properties, 'flyability', stability etc. • Quantification before MS • In some settings, it is possible to quantify the proteins or peptides before MS analysis, e.g. by gels, LC. • Semi-quantitative 'label-free' approaches • While the peak intensity does not correlate with protein abundance, the peptide count can be used for quantification (iBAQ, spectral counting, PAI) • Quantitative labeling approaches • Allow quantitative comparison of protein abundance under various conditions (iCAT, iTRAQ, SILAC)
Label-free 'SpectralCounting' approaches • Peptide frequency is correlated with protein abundance • only semi-quantitative • requires comparison over multiple runs, conditions must be stable & reproducible • normalization for protein size required (big proteins generate more peptides) • Observed vs. Non-observed • Frequently used line of argumentation. Statistics difficult; effects are easily overestimated • Difference 6 vs 0 observations typically not significant. (Audic &Claverie statistics) • Protein abundance index (PAI) • The number of observed peptides divided by the number of observable peptides per protein. • Related to the logarithm of protein abundance
SILAC • Stable isotope labeling by amino acids in cell culture • A frequently used type of metabolic labeling One cell culture is fed with Lys/Arg containing light C12 atoms One cell culture is fed with Lys/Arg containing heavy C13 atoms Proteins from the two cultures are mixed and analysed in a single experiment. The proteins and resulting peptides behave identically During MS analysis, all labeled ions appear as a duplet with a defined size difference. The intensity ratio of these peaks is a good proxy for the ratio of protein abundance in the two cultures
Isobariclabeling (TMT, iTRAQ) Two commercially available variants: TMT: Tandem Mass Tag iTRAQ: Isobaric Tag for relative and absolute quantitation Labeling is not done metabolically but at the protein or peptide level. Isobaric properties ensure that peptide differences are only observed after fragmentation
Demonstration von • Human Protein Atlas (http://www.proteinatlas.org) • ArrayExpress Expression atlas (http://www.ebi.ac.uk/gxa)