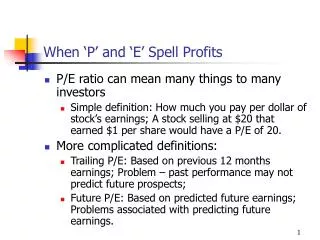
Download
1 / 21
210 likes | 286 Views
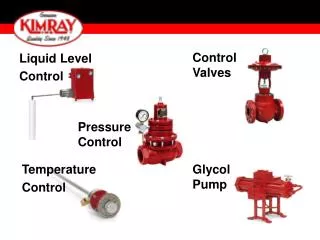
Learn how optimizing production efficiency and marketing strategies can enhance egg production control for increased profitability. Discover key nutrient requirements and the impacts of protein cost on profit optimization. Explore case studies and techniques for effective production management.

E N D
Production Control I: The Key To Profits David A. Roland1, Sr., M. M. Bryant1, M. Farmer2 and A. Roland3 Auburn University1 Auburn, AL Ridley Inc. 2 Mankato, MN Roland Poultry Services, LLC. 3 Auburn, AL SPSS Atlanta , GA January 21-23, 2008
Egg Producers (losing money) WE HAVE TOO MANY EGGS! Low Egg Prices Production Efficiency has never been better! MARKETING MANAGER PRODUCTION MANAGER
HIGH EGG PRICES AND PROFITS Come on girls…gimmie all you got! Production efficiency has never been better! We need more eggs! …OK! PRODUCTION MANAGER Goal: optimal production efficiency MARKETING MANAGER Goal: highest egg price Good Team Work Helps Optimize Profits
EXCESS EGGS = LOW EGG PRICES = NEGATIVE RETURNS Come on girls…gimmie all you got! Production has never been better! We have too many eggs! Losing Money ? PRODUCTION MANAGER Goal: optimal production efficiency MARKETING MANAGER Goal: highest egg price Poor Team Work Results in Excess Eggs and Negative Returns
PRODUCTION CONTROL = KEY TO PROFITS We have enough eggs! Okay girls. Take a breather, demand has been met Thank you MARKETING MANAGER Goal: Highest Egg Price PRODUCTION MANAGER New Goal: Optimal Profits Good Team Work = Reduced Egg Supply and Faster Return to Profits
Moral of the story…. Marketing and Production working together using new technology can improve production control and profits!
How nutrient requirements are determined ? maximum response Economically Optimal deficient Performance Nutrient requirement for max profit varies .72 .75 .79 .83 .87 .92 .97 1.01 8.0 14.3 14.8 15.3 15.8 16.5 17.2 17.8 18.5 Nutrientlevel (Lysine, Protein) Cost
a ME/h/d Typical Feeding Program
Feeding based on intake saves money. Blindly making changes.
Profits = UB egg price – [ Back of UB – Prod. Cost – Process. Cost – Feed Cost ] Example: Production cost Cost of nest run into package product delivered Back Urner Berry
Important Periods in Optimizing Protein and Energy 20th Century I. Prior to 50’s – fed one diet II. 60’s (fed based on age) % Prot. 20 14% III. 70’s ( fed based on intake) Lbs/100 h/d 18 19 20 21 22 18 19 20 21 22 18 19 20 21 22 IV. 80’s & 90’s (Envir. Cntl. & soft ware) % Prot. 20 14% 21st Century Lbs/100 h/d V. 2000’s Econometric Feeding 20 18 19 21 22 18 19 20 21 22 18 19 20 21 22 18.9 18.5 17.5 16.8 16.2 VI. Production Control Example: Product X
Econometric Feeding and Management (E F & M) Program • Feed formulation • Traditional feeding program • Record keeping * • Econometric Feeding and Management (E F & M) • PRODUCTION CONTROL
Lysine 1.02 0.92 0.83 1.02 0.92 0.83
Can we improve Lysine (mg/h/d) Delivery? 20.9 lbs/100 h/d 20.0 20 lb = 789 mg/h/d , 20.9 lb = 825 mg/h/d(5% variation)
Available Lysine Standard Pre-Molt Post-Molt I Lysine (mg/h/d) I Phases II Phases II III III IV IV Weeks of age Weeks after molt
Phase II - Egg Weight %Lys Diet 218 219 220 221 222 223
Flock Variation(Avg. wk 21-36) Environmental Control Complex Avg. – best 1 million + Variation in egg weights = 3.8g/egg (3.0 lb/case) vs 1.2 g/egg Variation in egg production = 10 % vs 2.4 % diet