Download
1 / 51
510 likes | 649 Views
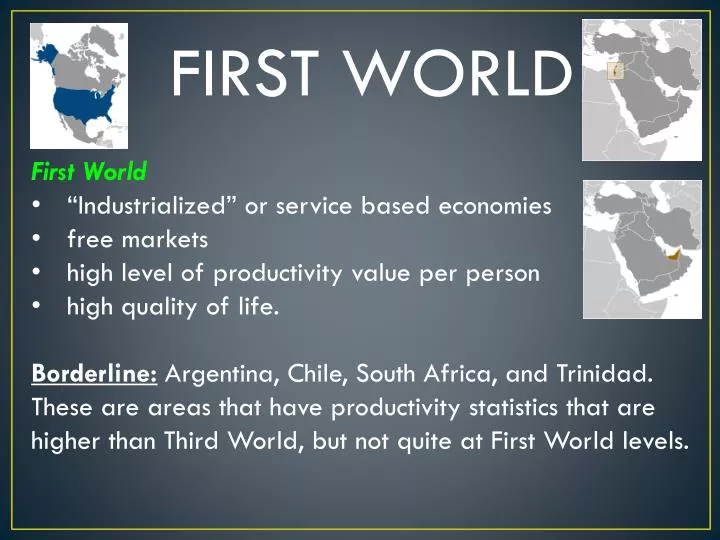
FIRST WORLD. First World “Industrialized” or service based economies free markets high level of productivity value per person high quality of life.

E N D
FIRST WORLD • First World • “Industrialized” or service based economies • free markets • high level of productivity value per person • high quality of life. • Borderline:Argentina, Chile, South Africa, and Trinidad. These are areas that have productivity statistics that are higher than Third World, but not quite at First World levels.
SECOND WORLD • Second World • Communist countries • Centrally planned economies • Occasionally used to designate “former communist” countries that are still restructuring their economy.
THIRD WORLD • Third World • Mainly Agricultural and resource-based economies • Low levels of per-person productivity • Low quality of life • Examples: Nepal Tanzania Kyrgyzstan
KNOW THE CALCULATIONS GDP GNI Trade Surplus Trade Deficit Per Capita Calculations Purchasing Power Estimates
1. GDP Gross Domestic Product is the dollar value of all goods and services produced in a country in one year. It measures the total volume of a country’s economy. GOODS + SERVICES This is done without adjusting for international trade; therefore it measures only the domestic economy.
2. GNI Gross National Income is the dollar value of all goods and services produced in a country, plus the dollar value of exports minus imports in the same year. This also measures economic volume. GOODS + SERVICES + (EXPORTS-IMPORTS)
3. TRADE SURPLUS Trade Surplus this adds value to the economy in countries where export values exceed import values. EXPORTS > IMPORTS This is a positive number, and adds value to the economy.
4. TRADE DEFICIT Trade Deficit this takes away value to the economy in countries where import values exceed export values. EXPORTS < IMPORTS This is a negative number, and removes value to the economy.
5. PER CAPITA CALCULATIONS Per Capita Latin “for every head” (GOODS + SERVICES)/ POPULATION [(GOODS + SERVICES) + (EXPORTS-IMPORTS)] / POPULATION
5. PER CAPITA CALCULATIONS These measures a country’s collective wealth or productivity. These are indicative of a relative standard of living measured by the services that such productivity produces for the population.
6. PURCHASING POWER ESTIMATES Complicated estimated indicators that do note have simple formulaic definitions. GNI PPP Gross National Income Purchasing Power Parity
6. GNI PPP Gross National Income Purchasing Power Parity This is an estimate that takes into account the differences in prices between countries. GNI per capita can make a First World country appear more prosperous than other statesand can make larger Third World States appear less prosperous, but it doesn’t factor in the cost of living in each country.
6. GNI PPP Gross National Income Purchasing Power ParityThe PPP correction theoretically makes a basic good, like a loaf of bread, the same price in all countries. In the US a loaf of bread costs $1 In China, it is the equivalent of $0.44 In China, the GNI per capita is about $2400, but this does not represent that money’s true value. China’s GNI PPP is $5400, which reflects the estimated actual value of an individual’s purchasing power.
7. HDI The Human Development IndexDesigned by the United Nations to measure the level of development of states based on a number of social indicators in addition to economic production. Combines GDP per capita, the adult literacy rate, average level of education, and total life expectancy.
7. HDI • Economic indicators of development • The Human Development Index (HDI) • Four factors used to assess a country’s level of development: • Economic = (1) gross domestic product (GDP) per capita • Social = (2) literacy and (3) amount of education • Demographic = (4) life expectancy
Why Does Development Vary Among Countries? • Economic indicators of development • Types of jobs • Primary sector • Secondary sector • Tertiary sector • Productivity • Measured by the value added per capita • MDCs are more productive than LDCs • Consumer goods
Why Does Development Vary Among Countries? • Social indicators of development • Education and literacy • The literacy rate • Health and welfare • Diet (adequate calories) • Access to health care
“A new century nears, and with it the prospects of a new civilization. Could we not begin to lay the basis for that new community with reasonable relations among all people and nations, and to build a world in which sharing, justice, freedom and peace might prevail?” http://www.brandt21forum.info/
Wallerstein’s World Theory Core Periphery Semi Periphery Brandt Line CORE- Rich nations that fuel the world’s economy Periphery- Low income countries provide inexpensive labor, sell raw materials Semi Periphery- remaining countries, still effected by Core Countries
Beware when you adopt North-South attitudes. -Australia and New Zealand -Most of the world’s less developed economies sit north or at the equator. Brandt Line
Brandt Line Australia and New Zealand
Brandt Line South Africa
Brandt Line Singapore and Taiwan
Gender Related Development GDI The GDI is used as a way of ranking development scores to compare the development of women compared to men in a society. However, looking at the Gender Development Index rankings might imply that those countries at the top of the list have gender equality.
WHERE DOES LEVEL OF DEVELOPMENT VARY BY GENDER? • Gender-Related Development Index (GDI) • Compares the level of women’s development with that of both sexes • Four measures (similar to HDI): • Per capita female incomes as a percentage of male per capita incomes • Number of females enrolled in school compared to the number of males • Percent of literate females to literate males • Life expectancy of females to males
WHERE DOES LEVEL OF DEVELOPMENT VARY BY GENDER? • Gender Empowerment Measure (GEM) • Compares the decision-making capabilities of men and women in politics and economics • Uses economic and political indicators: • Per capita female incomes as a percentage of male per capita incomes • Percentage of technical and professional jobs held by women • Percentage of administrative jobs held by women • Percentage of women holding national office
GENDER EMPOWERMENT MEASURE (GEM) A country with a lower GEM than GDI, offers women less power than economic resources.
MDGs The United Nations created Millennium Development GoalsThese goals are designed to eliminate poverty by he year 2015. Eight Development Goals seek to promote gender equality and empower women. http://www.un.org/millenniumgoals/
Rostow’s Stages of Growth • Traditional Society • Preconditions for takeoff • Takeoff • Drive to maturity • Age of mass consumption
Rostow’s Stages of Growth • Traditional Society • Economy focused on primary production (agriculture and fishing) • Limited wealth is spent on internally on things that do not promote economic development • Technological knowledge is low
Rostow’s Stages of Growth • Preconditions for Takeoff • Country’s leadership begins to invest the country’s funds in infrastructure • Roads, ports, school systems, electrification. • These promote economic development!
Rostow’s Stages of Growth • Takeoff • The economy begins to shift focus • Traditional Agriculture Factory Work • Experience gained in industrial production and business management.
Rostow’s Stages of Growth • Drive to maturity • Technology advancements diffuse throughout the country • Advancements in industrial production seen in many sectors of economy. • Workers become increasingly skilled and educated.
Rostow’s Stages of Growth • Age of mass consumption: • Technical knowledge and education levels are high. • Agriculture is mechanized (no longer traditional) and employs a small labor force.
Criticisms of Rostow • Rostow’s model is based on the historical development patterns of the United States and other industrialized countries. • EXAMPLE: Valuable Natural Resources extracted by powers in the Third World. • Independence Little to NO access to those resources.
Criticisms of Rostow • Barriers to development (corruption, capital flight) are not accounted for in Rostow’s theory.
What Challenges do LDCs face in developing their Economies? • Distance from markets • Inadequate infrastructure • Competition with existing manufacturers • Wealthy consumers in developed countries are far away! • Industrializing countries have to invest scarce resources into increased transportation. Support services for industrial development are often lacking in less developed countries. Direct support transportation, electricity Indirect support schools and universities
NEW INTERNATIONAL DIVISION OF LABOR Selective transfer of some jobs to LDCs this is a process that… keeps global inequalities in place discourages new industries from developing in LDCs prevents wealth from flowing from MDCs to LDCs This is very problematic because you have transnational corporations that are headquartered in MDCs but doing business globally. These companies seek out low-cost labor In LDCs but keep high skilled jobs in MDCs.
WHY DO LDCs FACE OBSTACLES TO DEVELOPMENT? • Financing development • LDCs require money to fund development • Two sources of funds: • Loans • The World Bank and the IMF • Structural adjustment programs • Foreign direct investment from transnational corporations http://maps.worldbank.org/ http://www.imf.org/external/
Women and Work Women work more hours per day (in paid AND unpaid labor)then men in every country in the world EXCEPT Anglo America and Australia. Muhammad Yunus
Some food for thought • Does our economy require other countries to remain underdeveloped? • Could we maintain our standard of living if the rest of the world had the same level of development, and thus presumably the same wages and costs of living? What does this mean for the future? • Are the people who live in this place year-round fortunate to live at such a desirable destination? • What do the local people depend on for income? Does tourism play a role? • What do the people in this country, who do not live in a tourist area, do for work? • Can any of these people, who wish to, come to our country on a vacation? Why not? Is that fair? Given current trends in the movement and growth of industry, is industry likely to remain important as a source of employment in our country? Why or why not?
WHY DO LDCs FACE OBSTACLES TO DEVELOPMENT? • Development through self-sufficiency • Characteristics: • Pace of development = modest • Distribution of development = even • Barriers are established to protect local business • Three most common barriers = (1) tariffs, (2) quotas, and (3) restricting the number of importers • Two major problems with this approach: • Inefficient businesses are protected • A large bureaucracy is developed