Download
1 / 11
110 likes | 136 Views
Chapter 1 Statistics: The Art and Science of Learning from Data. Section 1.2 Sample Versus Population. We Observe Samples but are Interested in Populations. Subjects The entities that we measure in a study. Subjects could be individuals, schools, rats, countries, days, or widgets.

E N D
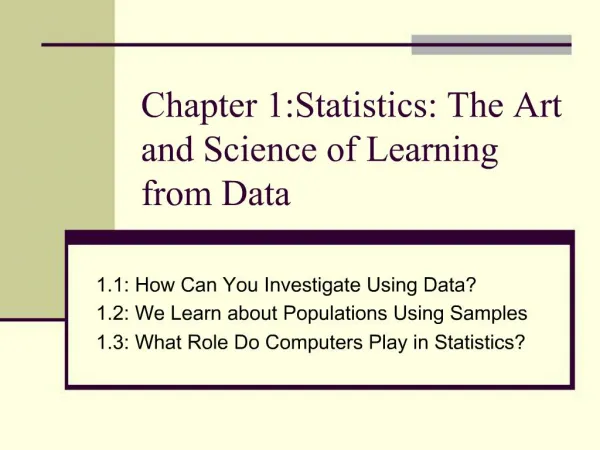
Chapter 1Statistics: The Art and Science of Learning from Data Section 1.2 Sample Versus Population
We Observe Samples but are Interestedin Populations • Subjects • The entities that we measure in a study. • Subjects could be individuals, schools, rats, countries, days, or widgets.
Population and Sample • Population: All subjects of interest • Sample: Subset of the population for whom we have data Population Sample
Example: An Exit Poll • The purpose was to predict the outcome of the 2010 gubernatorial election in California. • An exit poll sampled 3889 of the 9.5 million people who voted. Define the sample and the population for this exit poll. • The population was the 9.5 million people who voted in the election. • The sample was the 3889 voters who were interviewed in the exit poll.
Descriptive Statistics and Inferential Statistics • Descriptive Statistics refers to methods for summarizing the collected data. Summaries consist of graphs and numbers such as averages and percentages. • Inferential statistics refers to methods of making decisions or predictions about a population based on data obtained from a sample of that population.
Descriptive Statistics Example Figure 1.1 Types of U.S. Households, Based on a Sample of 50,000 Households in the 2005 Current Population Survey.
Inferential Statistics Example • Suppose we’d like to know what people think about controls over the sales of handguns. We can study results from a recent poll of 834 Florida residents. • In that poll, 54.0% of the sampled subjects said they • favored controls over the sales of handguns. • We are 95% confident that the percentage of all adult • Floridians favoring control over sales of handguns falls • between 50.6% and 57.4%.
Sample Statistics and Population Parameters • A parameter is a numerical summary of the population. • Example: Proportion of all teenagers in the United States who have smoked in the last month. • A statistic is a numerical summary of a sample taken from the population. • Example: Proportion of teenagers who have smoked in the last month out of a sample of 200 randomly selected teenagers in the United States.
Randomness and Variability • Random sampling allows us to make powerful inferences about populations. • Randomness is also crucial to performing experiments well.
Randomness and Variability • Measurements may vary from person to person, and just as people vary, so do samples vary. Measurements may vary from sample to sample. • Predictions will therefore be more accurate for larger samples.