Finite-Size Effects on Characteristic Scale in UrQMD Simulation Compared with DIRAC p-p-CF
This study analyzes the impact of finite-size effects on the characteristic scale in UrQMD simulation compared to DIRAC p-p-CF results. The critical region of r* is influenced by ω and η' pairs, leading to a shift in Pbr primarily due to ω pairs. The simulation shows Nw shifting by 15%, resulting in a small but significant effect on Pbr and time measurement uncertainties. The study suggests that systematic uncertainty in time measurement due to finite-size effects could be less than the present DIRAC statistical error in t, supporting the need for future multi-layer target studies in DIRAC research.

Finite-Size Effects on Characteristic Scale in UrQMD Simulation Compared with DIRAC p-p-CF
E N D
Presentation Transcript
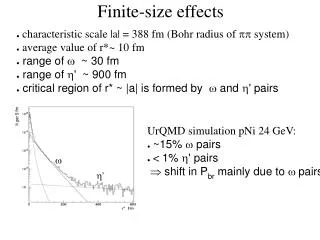
Finite-size effects • characteristic scale |a| = 388 fm (Bohr radius of pp system) • average value of r*~ 10 fm • range of ~ 30 fm • range of ' ~ 900 fm • critical region of r* ~ |a| is formed by and ' pairs UrQMD simulation pNi 24 GeV: • ~15% pairs • < 1% ' pairs shift in Pbr mainly due to pairs '
Finite-size effects Simulation compared with DIRAC p-p-CF • simulation Nw = 19.2% (for p-p- pairs) • fit result Nw = 21±7% Þ good description of pairs by UrQMD Finite-size effect induces shift in Pbr • according UrQMD simulation Nw = 15% ÞdPbr ~ 2% Þdt ~ 5% • upper limit at 1 sigma of p-p- fit Nw = 20% ÞdPbr ~ 3% Þdt ~ 7.5% Þ Systematic uncertainty in t measurement from finite-size effect < 10% i.e. less then present DIRAC statistical error in t. Expected shift with multi-layer target in future DIRAC 5 times less