Atomic Resolution Analysis of Ca3Co4O9 Structure
Explore atomic layers of Ca3Co4O9 through Z-contrast imaging and ELNES spectra. Understand differences in CoO2 and CoO layers at varying temperatures.

Atomic Resolution Analysis of Ca3Co4O9 Structure
E N D
Presentation Transcript
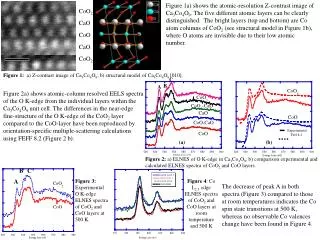
Figure 1a) shows the atomic-resolution Z-contrast image of Ca3Co4O9. The five different atomic layers can be clearly distinguished. The bright layers (top and bottom) are Co atom columns of CoO2 (see structural model in Figure 1b), where O atoms are invisible due to their low atomic number. C B A (a) (b) Experimental Feff 8.2 Figure 2: a) ELNES of O K-edge in Ca3Co4O9; b) comparison experimental and calculated ELNES spectra of CoO2 and CoO layers. CoO2 CaO CoO CaO CoO2 Figure 1: a) Z-contrast image of Ca3Co4O9; b) structural model of Ca3Co4O9 [010]. Figure 2a) shows atomic-column resolved EELS spectra of the O K-edge from the individual layers within the Ca3Co4O9 unit cell. The differences in the near-edge fine-structure of the O K-edge of the CoO2 layer compared to the CoO-layer have been reproduced by orientation-specific multiple-scattering calculations using FEFF 8.2 (Figure 2 b). B C A Figure 3: Experimental O K-edge ELNES spectra of CoO2 and CoO layers at 500 K. Figure 4: Co L2,3 edge ELNES spectra of CoO2 and CoO layers at room temperature and 500 K The decrease of peak A in both spectra (Figure 3) compared to those at room temperatures indicates the Co spin state transitions at 500 K, whereas no observable Co valences change have been found in Figure 4.