Climate Graphs
Climate Graphs. Reading the Weather. Vocabulary. Weather The day-to-day occurrence of climate conditions in a given place Climate The expected or normal weather conditions over a period of time in a given place Precipitation Rain, snow, sleet, hail Average

Climate Graphs
E N D
Presentation Transcript
Climate Graphs Reading the Weather
Vocabulary • Weather The day-to-day occurrence of climate conditions in a given place • Climate The expected or normal weather conditions over a period of time in a given place • Precipitation Rain, snow, sleet, hail • Average Measurements taken over an historical period of time (usually decades in length)
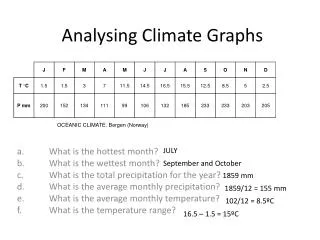
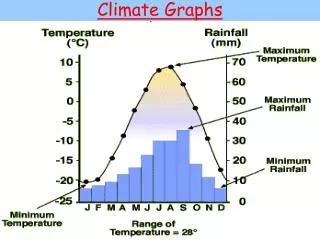
A Climate Graph • Shows average temperature and precipitation amounts over the course of a year • The blue bars indicate precipitation in mm • The red line indicates temperature in C° • The green area indicates the growing season, where temperatures are at least 6 °C
Which location has the highest annual precipitation? Which location has the lowest annual average temperature? Which location has the most drastic temperature change Which location has the driest winter? Which location has the most precipitation in one month? Which month? Which location has the most consistent temperature?
How long is the growing season in Vancouver, BC? If you to travel to Moncton, NB, when would be the best time of year to go (for good weather)? On a Summer day in Toronto, you can expect temperatures to be… Snow can be expected during which months in Timmins? What location has the wettest summer?
Paired Assignment News Team Assemble!
Research and Graphing • Choose a city and create a climate graph for that city. • You will learn how tomorrow • From the provided climate graphs: • Compare and contrast it to Toronto, Vancouver and Regina. • Find a location that best matches your chosen city. • Find a location that best contrasts your city. • Then answer the following questions for each climate graph used: Your city, Toronto, Vancouver, Regina and the most contrasting location • Which location has the highest annual precipitation? • Which location has the lowest annual average temperature? • Which location has the most drastic temperature change • Which location has the driest winter? • Which location has the most precipitation in one month? Which month? • Which location has the most consistent temperature? • How long are the growing seasons? • Which location has the wettest summer? • The ideal month of the year to travel to each location is…
News Report • Check the weather and climate for your city and for Toronto and then create a newscast that describes both (presentation of 5 min or less). • Your newscast should describe both weather and climate, making appropriate comparisons between both. • You should have fun with your news presentation. Be factual with your information and have fun with the rest. • Due Thursday. • Thinking: /10 • Good comparisons between cities • Application: /10 • Questions answered correctly • Communication: /10 • News story effectively communicates weather and climate facts • Knowledge: /10 • Climate graph is properly constructed, showing temperature, precipitation, growing season, averages and title