Download
1 / 14
140 likes | 235 Views
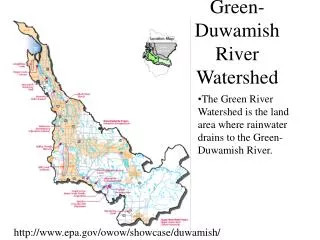
The Green River Water Rights Distribution Model (MODSIM) simulates daily flow distribution based on water rights. This update details improved calibration and network restructuring. Two scenarios were analyzed - Current and Full, revealing insights on flow predictions and development impacts. Future tasks involve integrating USBR data, analyzing scenarios, and enhancing documentation.

E N D
Green River Water Rights Distribution Model (MODSIM) Update By Division of Water Rights 8-27-12
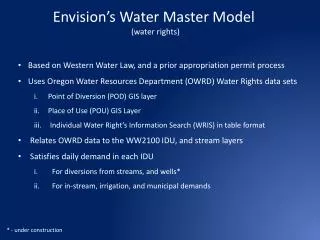
Green River Water Rights Distribution Model (MODSIM) Simulates the daily distribution of flows in the Green River by allocating available supply to competing demands based on water rights priorities. Recap of Improvements and Accomplishments Implemented to the model. • The model has been calibrated to the hydrologic conditions of the study period of 1970 to 2005 using observed gaged flows at Green and Jensen as a reference.
A three day lag routine was implemented in the model which improves the model’s statistical fit and mass balance of observed flows versus predicted flows • Correlation Coefficient (R2) of 97.8% at Green Gage and 99.2% at Jensen gage • Current (2010) estimated demands or depletions along the main stem of the Green River and White River (Utes Tribal rights) used for the calibration process were estimated at about 68,823.14 AF per season.
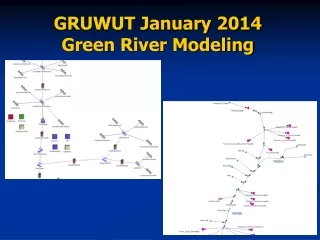
The network structure was revised by grouping water rights by priority dates serving each irrigation demand node. • Water rights in each reach were grouped in three main groups based on priority. • The first group includes water rights with priority prior to 1922. • The second group includes water rights with priorities between 1922 and 1957. • The third group includes water rights with priorities of 1958 to present.
All links in the network delivering water to a demand node were constrained not only by volume (max seasonal capacity) but also by daily flow (cfs) limitations based on the sum of the water rights contained in the link. • Two scenarios were ran: Current Scenario and Full Scenario. • The Current Scenario is the baseline scenario that simulates existing conditions in the river representing water supplies, demands, and developed water rights along the main stem of the Green River. • The Full Scenario simulates the impact of full development of approved rights on the system up to Utah’s portion of the Colorado River Compact.
Potential Use Total Allocation 1,369,000 acft Current Use 1,000,000 acft Remaining Use 369,000 acft Navajo Reserved Right 81,500 acft Maximum Potential 287,500 acft Modeled Potential 304,000 acft
Model Scenarios and Output Results Preliminary analysis of the output from the Current Scenario shows that: • The model generally under predicts flows at the Green River by an average of 70,159 AF a year (less than 2% of the average yearly flows over the 36 years of study) • The model under predicted the flows at Jensen by an average of 16,465 AF per year (0.54% of the observed yearly average). • During peak flow periods the model tends to over predict the flows. • Base flows are slightly under-predicted.
The MODSIM model predicts a total of 287 days with flows below 1300 cfs at the Green Gage versus 357 observed days. • A total of 246 days were observed to fall below 1300 cfs during the irrigation season (Apr-Oct) while 285 days were predicted by the model. • There were 110 days of observed flows below 1300 cfs during the non-irrigation (Nov-Mar) season and only 2 days were predicted • The discrepancy of # days during the non-irrigation season likely due to issues encountered by low water temperature during winter days, possibly ice formation on the observation wells causing the flows to show large variation from one day to the next.
Task in Development • Output data from the USBR Green River model portion of the CRSS Basin study will be integrated into MODSIM to simulate • future development scenarios • build-out potential • probable worst case demands or any other scenario as deemed necessary by the GRUWAT technical group. • Continue to run and analyze various scenarios as needed. • Continue working with the model documentation to clarify how the model works and to provide the necessary information about the structure of the model and its inputs.
Utah Work Plan • 2010-2011 , Develop model • 2010-2012 , Analyze Model Results • 2012-2014 , Obtain Additional Authority • 2014-2015 , Implement Legal Protection