Download
1 / 14
140 likes | 159 Views
Learn how Rutgers University partnered with ONR, Metron, WetLabs, and NAVO to support glider operations for coastal observation and prediction during RIMPAC 2008. Discover the glider specifications, science payload sensors, operations summary, and achievements.

E N D
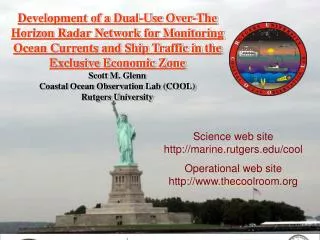
RIMPAC 2008: Rutgers Glider MCM Operational Support Partners: ONR, Metron, WetLabs, and NAVO Coastal Ocean Observation Lab http://marine.rutgers.edu/cool Regional Ocean Prediction http://marine.rutgers.edu/po Education & Outreach http://coolclassroom.org Coastal Observation and Prediction Sponsors:
Rutgers University(Largely support) • Provided 3-100m Slocum Coastal Electric Gliders to NAVOCEANO • On-site logistical support in case of emergency recoveries/redeployments • Off-site support for NAVOCEANO (glider configurations, science payload sampling, etc.) • QA/QC and dissemination of Inherent Optical Properties (IOPs): • bb(λ): Optical backscatter (470, 532, 660nm) • c(λ): : Optical attenuation (532nm) • NAVOCEANO took the lead on Slocum glider field operations
The Slocum Coastal Electric Glider Science Bay Specs. Length: 30 cm Diameter: 21.3 cm Max. Payload Weight: 4 kg Glider Specs. Length: 1.5 m Hull Diameter: 21.3 cm Weight: 52 kg
Science Payload Sensors(Modular, Swapable) • CTD – hydrography (Temperature, Salinity, Density) • Optical Sensors – • Eco bb3 pucks (blue, green and red light backscattering) • AUVB (green light attenuation)
Traditional Glider Piloting/Visualization Software and Data Flow Tactical Decision Aids
RIMPAC 2008 Glider Piloting/Visualization Software and Data Flow Tactical Decision Aids
Glider MCM Operations Summary: Penguin Banks (5 Deployments) sl113 (NAVOCEANO): 6/28/2008 – 7/26/2008 sl114 (NAVOCEANO): 6/28/2008 – 7/26/2008 ru05 (Rutgers): 7/07/2008 – 7/12/2008 ru05 (Rutgers): 7/18/2008 – 7/26/2008 ru16 (Rutgers): 7/03/2008 – 7/24/2008
Deployment Totals:5 deployments90 in-water glider days1533km flown> 10,000 profiles RU05: July 7, 2008 – July 12, 2008 Payload: CTD, OCR-504I, Eco bb puck Duration: 5 days Distance Traveled: 112km Profiles: 1150 RU05: July 18, 2008 – July 26, 2008 Payload: CTD, OCR-504I, Eco bb puck Duration: 8 days Distance Traveled: 131km Profiles: 482 RU16: July 3, 2008 – July 24, 2008 Payload: CTD, AUVB, Eco bb puck, Eco fl puck Duration: 21 days Distance Traveled: 500km Profiles: 4896 SL113: June 28, 2008 – July 26, 2008 Payload: CTD, AUVB Duration: 28 days Distance Traveled: 367km Profiles: 2136 SL114: June 28, 2008 – July 26, 2008 Payload: CTD, AUVB Duration: 28 days Distance Traveled: 423km Profiles: 1962
How Does this Array/Sampling Regime Help Visual the Battlespace?
Glider/Software Issues • Glider Configuration: • Payload configurations: • Instrument specific calibration coefficients for some instruments reside on the glider • Other instruments require application of calibration coefficients on shore and further processing. • Sampling configurations: • Flight controller is heavily burdened with flight, navigation and communication priorities • Glider sampling directives must be fine tuned to achieve optimum data collection. • FUTURE: all science data logged on science controller, which should eliminate many (if not all) of these issues. • Shore-Side Processing: • FTP of raw glider data files to Rutgers • Processing at Rutgers • FTP profile data back to NAVOCEANO/NRL Long data pipelines = lag time between measurement and application of measurement for MCM operations!
Field Issues • Working across 5 timezones – lag between when you want something done and when it is actually done! • Damage as a result of Deployment/Recovery in heavy seas • Final Data Collection (making sure all data is shore-side before wiping flash cards)
What Did We Achieve? • Successful transfer of AUV control from Rutgers University to NAVOCEANO for 24-hour Operations • Successful characterization of the Operational Area using a fleet of AUVs deployed outside the area of interest
Future Recommendations • NAVOCEANO – more deployments, more deployments, more deployments! • Shore-side data QA/QC (NAVOCEANO, NRL?) • Data visualization tools (TWRC, NAVOCEANO, NRL?)