Download

1 / 45
450 likes | 600 Views
Biological information analysis by heterogeneous data comparison. Advisor: Pro. Chuan Yi Tang Speaker: Jeh Ting Hsu. Outline. Extraction of correlated gene clusters by multiple graph comparison. Bayesian Network. Generalized kernel canonical correlation analysis.

E N D
Biological information analysis by heterogeneous data comparison Advisor: Pro. Chuan Yi Tang Speaker: Jeh Ting Hsu
Outline • Extraction of correlated gene clusters by multiple graph comparison. • Bayesian Network. • Generalized kernel canonical correlation analysis. • Filling gaps in a metabolic network using expression information.
Extraction of correlated gene clusters by multiple graph comparison
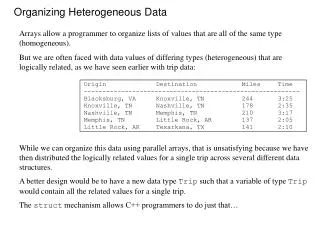
Motivation • The complete genome sequence contains the information about ordering of genes along the chromosome. Besides such geometrical relationships, other features characterize relationships among genes, including similarity relationships based on sequences or 3D structures of gene products, and functional relationships in metabolic/regulatory pathways. • When multiple gene gene relationships can be found on different attributes as above, it would be interesting to see whether or not a set of genes share their mutual relationships in relation to each attribute.
Example • the enzymes in the glycolytic pathway commonly displayα/β folds, which is obtained by examining the relationships of enzymes with respect to their structural similarities and neighboring relationships in the pathway. This type of observation has been made for a specific set of genes. Here we examine all the sets of genes in a given organism that are correlated with respect to more than one attribute. A series of enzymes in the glycolytic pathway display fold.
Gene-gene relationships on a specific attribute can be denoted by using a set of binary relationships in a general manner. For example, let a binary operator ’∼’ denote a binary relationship between two genes, and let g1, g2, g3, and g4 be a series of genes arranged in this order in a genome sequence, their geometrical relationships are broken down into a set of binary relationships {g1 ∼ g2, g2 ∼ g3, g3 ∼ g4}. A set of binary relationships among genes forms a graph structure as a whole. Each graph node corresponds to a gene or a gene product. In a graph, two nodes are connected by an edge (expressed by a solid line) when they are related by a binary relationship.
Protein interaction networks are comprised of groups of interaction proteins.
Heuristic algorithm for network comparisonLet consider 2 graphs: G1=(V1,E1) and G2=(V2,E2)d1(i,j) : the shortest path between nodes v1i and v1j in graph G1d2(i,j) : the shortest path between nodes v2i andv2j in graph G2
E. Coli correlated gene clusters The structure similarity dataset defines 3D strucral similarities among proteins. Two proteins in the same category are connected by an edge.
Using the distance D, we cluster the hyperedges. Let C be the initial set of clusters, each of which consists of a single hyperedge, i.e., C ={{h1},…, {hm} . Starting with C, we iterate the procedure to pick two clusters between which the distance is the smallest and to merge them into a new cluster (i.e., hierarchical clustering using the distance D).
References • Tohsato Y., Matsuda H., Hashimoto, A. A Multiple Alignment Algorithm for Metabolic Pathway Analysis using Enzyme Hierarchy. in International Conference on Intelligent Systems for Molecular Biology (ISMB). AAAI Press, 2000. • Hiroyuki Ogata, Wataru Fujibuchi, Susumu Goto and Minoru Kanehisa. A heuristic graph comparison algorithm and its application to detect functionally related enzyme cluster. Nucleic Acids Research,2000,vol 28, 4021-4028.
Motivation • Whereas gene coexpression data are an excellent tool for hypothesis generation, microarray data alone often lack the degree of specificity needed for accurate gene function prediction. • This improvement in specificity can be achieved through incorporation of heterogeneous functional data in an integrated analysis. • The system is based on a Bayesian network that combines evidence from diverse data sources to predict whether two proteins are functionally related. • The network essentially performs a probabilistic ‘‘weighting’’ of data sources, thus avoiding double counting evidence and allowing for formal representation of expert knowledge about the methods.
Functional Relationship Expression Data Type Data Noise Level Coexpression K-means Clustering Self Organizing Maps Hierarchical Clustering General architecture of the MAGIC Bayesian Network (expression data)
Functional Relationship Colocalization Transcription Factor Binding Physical Association Genetic Association Unlinked Noncomple mentation Affinity precipitation Synthetic Rescue Direct Binding Two Hybrid Synthetic Lethality Dosage Lethality Purified Complex Reconstructed Complex Biochemical Assay General architecture of the MAGIC Bayesian Network. (nonexpression-based data)
Physical Association Affinity precipitation Direct Binding Two Hybrid Conditional Probability Table
References • Gasch, A. P., Spellman, P. T., Kao, C. M., Carmel-Harel, O., Eisen, M. B., Storz, G., Botstein, D. and Brown, P. O. (2000). Genomic expression programs in the response of yeast cells to environmental changes. Mol Biol Cell 11, 4241-57. • Olga G. Troyanskaya, Dolinski K, Owen AB, Altman RB, and Botstein D. A Bayesian framwork for combining heterogeneous data sources for gene function prediction. Proc Natl Acad Sci USA 100(14): 8348-53, 2003. • http://biodata.mshri.on.ca/grid/servlet/Index • http://cgsigma.cshl.org/jian/
Motivation • It is crucial to investigate the correlation which exists between multiple biological attributes, and eventually to use this correlation in order to extract biologically meaningful features from heterogeneous genomic data. • Indeed, a correlation detected between multiple datasets is likely to be due to some hidden biological phenomenon. Moreover, by selecting the genes responsible for the correlation, one can expect to select groups of genes which play a special role in or are affected by the underlying biological phenomenon.
Example • As an example, the existence of operons in prokaryotes is responsible for a form of correlation between several datasets, because genes which form operons are close to each other along chromosomes, have similar expression profiles and can catalyze successive reactions in a pathway. Conversely, one can start from three datasets containing the localization of the genes on the genome, their expression profiles, and the chemical reactions they catalyze in known pathways, and look for correlations between these datasets, in order to finally recover groups of genes, which may form operons.
Methods • Canonical correlation analysis (CCA). • However, ordinary CCA cannot be applied to non-vectorial genomic data, such as pathways, protein-protein interactions or gene positions in a chromosome. • Kernel CCA (KCCA). • Its goal is to detect correlations between two datasets. • Multiple kernel CCA (MKCCA). • Integrated kernel CCA (IKCCA). • One can prefer to maximize the correlation between one type of attribute and a combination of other types.
Kernel function dij is the number of nucleotides between the end of the ith gene and the start of the jth gene along the chromosomes.
References • Yamanishi Y., Vert, J.-P., and Kanehisa, M., Heterogeneous data comparison and gene selection with kernel canonical correlation analysis, In Schoelkopf, B., Tsuda, K., and Vert, J.-P., editors, Kernel Methods in Computational Biology, pp.209-230, MIT Press, 2004. • Yamanishi, Y., Vert, J.-P., Nakaya, A. and Kanehisa, M., Extraction of Correlated Gene Clusters from Multiple Genomic Data by Generalized Kernel Canonical Correlation Analysis. Bioinformatics (in ISMB2003), 19, i323-i330.
Filling gaps in a metabolic network using expression information
Motivation • With a growing number of completely sequenced genomes, increasing attention has been devoted to understanding the functional coordination of individual genes in complex biological processes. • Computational reconstruction of metabolic networks typically uses genomic information to associate genes with enzymatic functions, thereby identifying the metabolic pathways encoded by the organism. • In many cases, while there exists sufficient biological evidence to believe that a given pathway is present in an organism, one or more enzymes responsible for the critical reaction steps cannot be identified via sequence homology methods alone. Similarity of gene expression profiles has been used extensively to assign genes to general functional categories. • However, prediction of specific gene function from expression information alone has, so far, not been possible.
Specific functional predictions can be made by considering expression similarity together with the structural information of the metabolic network.
Hughes, T.R., Marton, M.J.,Jones, A.R., Roberts, C.J., Stoughton, R., Armour, C.D., Bennett, H.A., Coffey, E., Dai, H., He, Y.D. et al. Functional discovery via a compendium of expression profiles. Cell, 2000, 102, 109-126.
The metabolic gene dependency graph is then used to calculate network distance between the genes. We define a pair of directly dependent metabolic genes X and Y to be separated by a distance 1; similarly, the distance between X and Z, given dependencies between X->Y and Y->Z, is 2 and so on. The expression distance measure between ORFs X and Y is calculated as 1- |corr(px, py)|, where corr(px,py) is the Spearman’s rank correlation between expression profile vectors of X and Y.
Local coexpression in the metabolic network. Mean expression distance is shorwn as a function of the network distance between metabolic genes.
Given a node L in the metaqbolic dependency graph, and a set of candidate ORF’s, we can evaluate the similarity of expression profile of each candidate ORF with each member of the metabolic neighborhood of location L. cost function (Type 1): X is the candidate gene. R is the network neighborhood radius. N is a neighborhood of radius R around the metabolic location L. |N| is the total number of genes in the neighborhood. Ni is the set of genes in the i-th layer of the network neighborhood, d(x,y) is the expression distance between genex and gene g. w is a vector of the neighobrhood layer weights and p is the positive power factor.
References • Forster, J., Famili,I., Fu, P., Palsson, B.O. and Nielsen, J. Genome-scale reconstruction of the Saccharomyces cerevisiae metabolic network. Genome Res., 2003, 13, 244-253. • Hughes, T.R., Marton, M.J.,Jones, A.R., Roberts, C.J., Stoughton, R., Armour, C.D., Bennett, H.A., Coffey, E., Dai, H., He, Y.D. et al. Functional discovery via a compendium of expression profiles. Cell, 2000, 102, 109-126. • Kharchenko, P., Vitkup, D., Church, G.M. Filling gaps in a metabolic network using expression information. Bioinformatics, 2004, 20 Suppl. 1,i178-i185.