Download
1 / 45
450 likes | 470 Views
This joint OSSE initiative aims to assess the impact of future observing systems on weather forecasting through simulation experiments, involving internationally collaborative institutes.

E N D
Joint OSSEs Internationally collaborative Full OSSEs sharing the same Nature Run Michiko Masutani NOAA/NWS/NCEP/EMC http://www.emc.ncep.noaa.gov/research/JointOSSEs FORMOSAT3/COSMIC OSSE Sep. 3-4,2009
International Collaborative Joint OSSE - Toward reliable and timely assessment of future observing systems - http://www.emc.ncep.noaa.gov/research/JointOSSEs Participating Institutes [1]National Centers for Environmental Prediction (NCEP) [2]NASA/Goddard Space Flight Center (GSFC) [3]NOAA/ NESDIS/STAR, [4]ECMWF, [5]Joint Center for Satellite and Data Assimilation (JCSDA) [6]NOAA/Earth System Research Laboratory (ESRL) [7]Simpson Weather Associates(SWA), [8]Royal Dutch Meteorological Institute (KNMI) [9]Mississippi State University/GRI (MSU) [10]University of Utah Other institutes expressing interest Northrop Grumman Space Technology, NCAR, NOAA/OAR/AOML, Environment of Canada, National Space Organization (NSPO,Taiwan), Central Weather Bureau(Taiwan), JMA(Japan), University of Tokyo, JAMSTEC, Norsk Institutt for Luftforskning (NILU,Norway), CMA(China), and more
Planned OSSEs (as of Sep. 2009) Future GPSRO constellation configuration and impact Lidia Cucurull (JCSDA,NOAA/NESDIS), NCAR, CWB, NPSO GOES-R preparation experiments (NOAA/NESDIS) Tong Zhu,, Fuzhong Weng, T.J. Kleespies, Yong Han, Q. Liu, Sid Boukabara (NOAA/NESDIS), Jack Woollen, Michiko Masutani (NOAA/EMC), L. P Riishojgaard (JCSDA)), Wind Lidar (GWOS) impact and configuration experiments for NASA M.Masutani(NCEP), L. P Riishojgaard (JCSDA) Simulation of DWL planned from NASA and selected DWL from ESA G. David Emmitt, Steve Greco, Sid A. Wood,(SWA) Simulation of ADM-Aeolus and follow up mission G.J. Marseille and Ad Stoffelen (KNMI) Evaluation of Unmanned Aircraft System Yuanfu Xie, Nikki Prive, Tom Schlatter, Steve Koch (NOAA/ESRL) Michiko Matsutani, Jack Woollen (NOAA/EMC) NPP (CrIS and ATMS) regional impact studies (NASA) C. M. Hill, P. J. Fitzpatrick, X. Fan, V. Anantharaj, and Y. Li (MSU)
What are OSSEs Diagrams to explain OSSEs
Data Denial Experiments Real dataOSE Simulated data (OSSE) Observing System Simulation Experiment • Typically aimed at assessing the impact of a hypothetical data type on a forecast system • Simulated atmosphere (“Nature Run”) • Simulated reference observations (corresponding to existing observations) • Simulate perturbation observations (object of study) • Verify simulated observation • Evaluate observational error • Control run (all operationally used observations) • Perturbation run (control plus candidate data) • Compare! Costly in terms of computing and manpower Observing System Experiment • Typically aimed at assessing the impact of a given existing data type on a system • Using existing observational data and operational analyses, the candidate data are either added to withheld from the forecast system, and the impact is assessed • Control run (all operationally used observations) • Perturbation run (control plus candidate data) • Compare!
Simulation of Existing data + Proposed data (DWL, CrIS, ATMS, UAS, etc) Verification of data Adding Observational error Nature Run Current observing system DATA DUMP OSSE DATA DUMP OSSE Quality Control (Simulated conventional data) Real Radiance data Quality Control (Real conventional data) Simulated Radiance data OSSE DA (Include new obs) DA GDAS OSSE NWP forecast NWP forecast NCEP system
DAS,OSE,OSSE Diagram Diagram by Lars Peter Riishojgaard JCSDA
Benefit of OSSEs Need for OSSEs • OSSEs help in understanding and formulating observational errors • DAS (Data Assimilation System) will be prepared for the new data • Enable data formatting and handling in advance of “live” instrument • OSSE results also showed that theoretical explanations will not be satisfactory when designing future observing systems. ♦Quantitatively–based decisions on the design and implementation of future observing systems ♦Evaluate possible future instruments without the costs of developing, maintaining & using observing systems. Simulating observational data requires a significant amount of work. However, if we cannot simulate observations, how could we assimilate observations? (Jack Woollen)
Full OSSEs • There are many types of simulation experiments. Sometimes, we have to call our OSSE a ‘Full OSSE’ to avoid confusion. • A Nature Run (NR, proxy true atmosphere) is produced from a free forecast run using the highest resolution operational model which is significantly different from NWP model used in DAS. • Calibration to compare data impacts between real and simulated data will be performed. Without calibration quantitative evaluation of data impact is not possible. • Data impact on analysis and forecast will be evaluated. • A Full OSSE can provide detailed quantitative evaluations of the configuration of observing systems. • A Full OSSE can use an existing operational system and help the development of an operational system
Why a (International) Joint OSSE capability? • OSSEs are expensive • Nature Run, entire reference observing system, additional observations must be simulated • Calibration experiments, perturbation experiments must be assessed according to standard operational practice and using operational metrics and tools • OSSE-based decisions have many stakeholders • Decisions on major space systems have important scientific, technical, financial and political ramifications • Community ownership and oversight of OSSE capability is important for maintaining credibility • Independent but related data assimilation systems allow us to test robustness of answers
Nature Run The Nature Run is a long, uninterrupted forecast by a NWP model whose statistical behavior matches that of the real atmosphere. The ideal Nature Run would be a coupled atmosphere-ocean-cryosphere model with a fully interactive lower boundary. Our real Nature Run is a compromise according to current development and that will limit the OSSE capability. The advantage of using a long, free-running forecast to simulate the Nature Run is that the simulated atmospheric system evolves continuously in a dynamically consistent way. One can extract atmospheric states at any time. Analysis lacks dynamical consistency. It does not matter that the Nature Run diverges from the real atmosphere a few weeks after the simulation begins providedthat the climatological statistics of the simulation match those of the real atmosphere. A Nature Run should be a separate universe, ultimately independent from but with very similar characteristics to the real atmosphere. Current choice of Nature Run: Long free forecast run forced by daily SST and ice from analysis
New Nature Run by ECMWF Produced by Erik Andersson(ECMWF) Based on discussion with JCSDA, NCEP, GMAO, GLA, SIVO, SWA, NESDIS, ESRL, and ECMWF Low Resolution Nature Run Spectral resolution : T511 , Vertical levels: L91, 3 hourly dump Initial conditions: 12Z May 1st, 2005 , Ends at: 0Z Jun 1,2006 Daily SST and ICE: provided by NCEP Model: Version cy31r1 Two High Resolution Nature Runs 35 days long Hurricane season: Starting at 12z September 27,2005, Convective precipitation over US: starting at 12Z April 10, 2006 T799 resolution, 91 levels, one hourly dump Get initial conditions from T511 NR Note: This data must not be used for commercial purposes and re-distribution rights are not given. User lists are maintained by Michiko Masutani and ECMWF.
Archive and Distribution To be archived in the MARS system at ECMWF To access T511 NR, set expver = etwu • Copies are available to designated users for research purposes & users known to ECMWF • Saved at NCEP, ESRL, and NASA/GSFC • Complete data available from portal at NASA/GSFC • Contacts: Michiko Masutani (michiko.masutani@noaa.gov), • Harper Pryor (Harper.Pryor@nasa.gov ) • Gradsdods access is available for T511 NR. The data can be downloaded in grib1, NetCDF, or binary. The data can be retrieved globally or for selected regions. • Provide IP number to: Arlindo da Silva (Arlindo.Dasilva@nasa.gov)
Supplemental low resolution regular lat lon data 1deg x 1deg for T511 NR Pressure level data:31 levels, Potential temperature level data: 315,330,350,370,530K Selected surface data for T511 NR: Convective precip, Large scale precip, MSLP,T2m,TD2m, U10,V10, HCC, LCC, MCC, TCC, Sfc Skin Temp T511 verification data is posted from NCAR CISL Research Data Archive. Data set ID ds621.0. Currently an NCAR account is required for access. (Contact Harper.Pryor@nasa.gov) (Also available from NCEP HPSS, ESRL, NCAR/MMM, NRL/MRY, Univ. of Utah, JMA, Mississippi State Univ.)
Nature Run validation • Purpose is to ensure that pertinent aspects of meteorology are represented adequately in NR • Contributions from Reale, Terry, SWA, Prive, Masutani, Jusem, R. Tompkins, Jung, Andersson, R Yang, R. Errico and many others • Extratropical cyclones (tracks, cyclogenesis, cyclolosis) • Tropical cyclones, tropical wave • Transient Eddy kinetic energy • Mean circulation • Clouds • Precipitation • Arctic boundary layer • Low level Jet • Rossby wave Improper Nature Run will fail with calibration of OSSE. Identical twin, Fraternal twin Nature Run, sequence of analysis runs are not expected to pass calibration.
Evaluation of theT511 Nature run • Utilize Goddard’s cyclone tracking software (Terry and Atlas, AMS conf, Aug 1996): • Identifies and tracks mostly extratropical cyclones (cutoff at 20 deg N/S latitude) • Interfaces with GrADS contouring algorithm • Uses SLP field at 4hPa contour interval • Finds centroid of inner-most closed isobar • Tracks the centers using extrapolation and 500hPa steering Cloud Cover Comparison between the ECMWF T511 Nature Run against climatology 20050601-20060531, exp=eskb, cycle=31r1 Adrian Tompkins, ECMWF NR MODIS NR-MODIS Tropics Oreste Reale (NASA/GSFC/GLA) Seasonal mean zonal mean zonal wind jet maximum strength and latitude of the jet maxima for the ECMWF reanalysis (1989-2001, blue circles) and the Nature Run (), northern hemisphere. (N. Prive.) Vertical structure of a HL vortex shows, even at the degraded resolution of 1 deg, a distinct eye-like feature and a very prominent warm core. Structure even more impressive than the system observed in August. Low-level wind speed exceeds 55 m/s.
T511 Nature Run is found to be representative of the real atmosphere and suitable for conducting reliable OSSEs for midlatitude systems and tropical cyclones. (Note: MJO in T511 Nature Run is still weak.) There are significant developments in high resolution forecast models at ECMWF since 2006 and a more realistic tropics for T799 Nature Run is expected with a newer version of the ECMWF model. ECMWF agreed to generate a new T799 NR, when the Joint OSSE team has gained enough experience in OSSEs with T511NR and is ready to make the best use of the high resolution Nature Run. For the time being, the Joint OSSE team will concentrate on OSSEs using the T511 Nature Run.
Simulation of Observations for calibration The output data is saved in BUFR format which can be read by the Gridpoint Statistical Interpolation (GSI). GSI is a DAS used at NCEP, GMAO and ESRL. The codes are flexible and include many tunable parameters. Initially, observational error will not be added. GMAO will provide software to add random error. Simulated observations will be posted from NASA/NCCS portal. GMAO will provide calibrated simulated observations. NCEP-NESDIS will provide additional data which are not simulated by GMAO. Some calibration will be performed but users are expected to perform their own calibrations. Some simulation by GMAO may be repeated for the complete period. Each group will make separate directories for simulated observations at the NASA portal.
GMAO Observation Simulator for Joint OSSE • Software for generating conventional obs (observation type included in NCEP prepbufr file). Surface data are simulated at NR surface height. • Software for simulating radiances: code to simulate HIRS2/3, AMSUA/B, AIRS, MSU has been set up. Community Radiative Transfer Model (CRTM) is used for forward model. Random sampling-based uses High, Mid, Low level cloud cover, and precipitation to produce a realistic distribution of cloud clear radiance. • Software for generating random error. • Calibration is performed using Adjoint technique. Distribution Simulated observations will be calibrated by GMAO before becoming available. Limited data are now available for people who contribute to validation and calibration. Contact: Ron Errico: ronald.m.errico@nasa.gov
Simulation of radiance data at NCEP and NESDIS Step 1. Thinning of radiance data based on real use For development purposes, 91-level model variables are processed at NCEP and interpolated to observational locations with all the information needed to simulate radiance data (DBL91). DWL91 will be posted at NASA portal. The DBL91 are for quick work and also used for development of CRTM. GOES and SBUV are simulated as they are missing from GMAO dataset. AMSUA, AMSUB, GOES data have been simulated for entire T511 NR period. DBL91 for HIRS2, HIRS3 are also prepared, saved and will be posted. DBL91 for AIRS will not be saved. Step 2. Simulation of radiance data using cloudy radiance Cloudy radiance is still under development. Accuracy of GMAO data will be between Step1 and Step2.
GOES May 2 00z Real data are plotted for all foot prints. Simulated data are plotted for foot prints used at NCEP GDAS.
Simulation of SBUV ozone data Jack Woollen (NCEP) Simulated Real Plot produced by by Jack Woollen
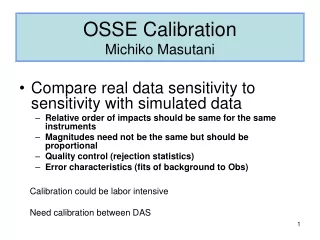
OSSE Calibration Calibration of OSSEs verifies the simulated data impact by comparing it to real data impact. The data impact of existing instruments has to be compared to their impact in the OSSE. The calibration includes adjusting observational error. If the difference is explained, we will be able to interpret the OSSE results as to real data impact. The results from calibration experiments provide guidelines for interpreting OSSE results on data impact in the real world. Without calibration, quantitative evaluation data impact using OSSE could mislead the meteorological community. In this OSSE, calibration was performed and presented.
Progress in Calibration • GMAO is conducting calibration using adjoint method. • Focused on July August 2006 and December 2005-January 2006. • ESRL and NCEP are working on calibration using data denial method and fits to observation. • Using simulated data by GMAO and additional data from NCEP. • Focused on July-August 2005. • GSI version May 2007. • NCEP is working on upgrading OSSE system to newer GSI to accommodate DWL and flow dependent error covariances. Some calibrations will be repeated.
Calibration for Joint OSSEs at NASA/GMAO Version 4 Version 1 REAL OSSE REAL OSSE Real Most recent Version 2 OSSE REAL OSSE Calibration using adjoint technique This figure shows the mean change in E-norm of the 24-hour forecast error due to assimilating the indicated observation types at 00 UTC for OSSE (top) and real assimilation, or CTL (bottom) for the period of January 2006. Version 1 • Overall impact of simulated data seems realistic • Tuning parameter for cloud clearing (courtesy of Ron Errico and R. Yang)
RMS (Forecast-Observation), 200hPa wind Real Simulated Global NH NH Global SH Trop SH Trop N. A Euro Euro N. A Asia Asia By Jack Woollen First one week is spin up period
RMS (Analysis-Observation), 500hPa Height Real Simulated Global NH NH Global SH Trop SH Trop N. A Euro Euro N. A Asia Asia By Jack Woollen First one week is spin up period
Planned OSSEs (as of Sep. 2009) Future GPSRO constellation configuration and impact Lidia Cucurull (JCSDA(NOAA/NESDIS), NCAR, CWB, NPSO GOES-R preparation experiments (NOAA/NESDIS) Tong Zhu,, Fuzhong Weng, T.J. Kleespies, Yong Han, Q. Liu, Sid Boukabara (NOAA/NESDIS), Jack Woollen, Michiko Masutani (NOAA/EMC), L. P Riishojgaard (JCSDA)), Wind Lidar (GWOS) impact and configuration experiments for NASA M.Masutani(NCEP), L. P Riishojgaard (JCSDA) Simulation of DWL planned from NASA and selected DWL from ESA G. David Emmitt, Steve Greco, Sid A. Wood,(SWA) Simulation of ADM-Aeolus and follow up mission G.J. Marseille and Ad Stoffelen (KNMI) Evaluation of Unmanned Aircraft System Yuanfu Xie, Nikki Prive, Tom Schlatter, Steve Koch (NOAA/ESRL) Michiko Matsutani, Jack Woollen (NOAA/EMC) NPP (CrIS and ATMS) regional impact studies (NASA) • M. Hill, P. J. Fitzpatrick, X. Fan, V. Anantharaj, and Y. Li (MSU)
OSSE for GNSS Radio-Occultation (RO) observationsLidia Cucurull (JCSDA) Occulting GPS Ionosphere Neutral atmosphere LEO Earth
OSSE to evaluation space based DWL OSSE to evaluate DWL M.Masutani(NCEP), L. P Riishojgaard (JCSDA), Jack Woollen (NCEP) Simulation of DWL at SWA G. David Emmitt, Steve Greco, Sid A. Wood, ADM-Aeolus simulation for J-OSSEG.J. Marseille and Ad Stoffelen (KNMI)
ADM-Aeolus simulation for J-OSSE KNMI planG.J. Marseille and Ad Stoffelen Verification against SWA ADM simulation. Simulation consistency needed for • Clouds • Laser beam cloud hit from model grid box cloud cover. Random? • Cloud backscatter and extinction from model clouds • Maximum overlap between clouds in adjacent (vertical) levels • Aerosols • Backscatter and extinction • Horizontal variability • along track over 50 km accumulation length • between adjacent observations (separated by 150 km) • Vertical variability (stratification) • Dynamics • Wind variability over 50 km accumulation length TOGETHER Towards a Global observing system through collaborative simulation experiments • Spring 2008: ADM Mission Advisory Group (ADMAG) advises ESA to participate in Joint OSSE • KNMI writes TOGETHER proposal to ESA • ADM OSSE heritage, for details see Stoffelen et al., 2006 http://www.knmi.nl/~marseill/publications/fulltexts/osse.pdf • Tools for retrieving Nature Run fields from ECMWF archive • Orbit simulator • Interpolation of model fields to ADM location − “True” (HLOS) wind • Instrument error: LIPAS (Lidar Performance Analysis Simulator) • For details see Marseille and Stoffelen, 2003 http://www.knmi.nl/~marseill/publications/fulltexts/dwlsimul.pdf • LIPAS is updated and compatible with L2B processor performance • Representativeness error • Unresolved model scales in nature run and ADM sampling determines representativeness error to be added to ADM HLOS wind observation • ADM continuous mode • ESA decision December 2008 • If continuous mode is selected then more funding will probably become available for additional simulation studies • Simulation of post-ADM scenarios • EUMETSAT funding?
In Spring, 2008 Simpson Weather Associates, Inc. established the Doppler Lidar Simulation Model version 4.2 on an Apple dual quad processor computer for the SensorWeb project. SSH, the network protocol that allows data to be exchanged over a secure channel between two computers, was installed and tested. SWA and SIVO were able to test the push/pull and communications functionality successfully. SIVO was able to push DLSM inputs to SWA and request model simulations. The DLSM was successfully executed and SIVO was able to retrieve DWL coverage and DWL line-of-sight wind products for a six hour simulation in less than 2 minutes.
OSSEs to investigate GOES data usage and prepare for GOES-RTong Zhu (CIRA/CSU), Fuzhong Weng (NOAA/NESDIS), Jack Woollen (NOAA/EMC), Michiko Masutani (NOAA/EMC), Thomas J. Kleespies(NOAA/NESDIS), Yong Han(NOAA/NESDIS), Quanhua, Liu (QSS), Sid Boukabara (NOAA/NESDIS),Steve Load (NOAA/EMC), This project involves an OSSE to evaluate current usage of GOES data Simulation of GOES-12 Sounder Observed GOES-12 Sounder Observed GOES-12 18 bands on 0230 UTC October 01, 2005 for North Atlantic Ocean section. Nature Run hurricane generated on September 27. At 1200 UTC October 1, it is located at about 43 W, 20N. The high moisture air mass associated with the hurricane is shown clearly. by Tong Zhu
Evaluation of Unmanned Aircraft System Yuanfu Xie, Nikki Prive, Tom Schlatter, Steve Koch (NOAA/ESRL) Michiko Matsutani, Jack Woollen (NOAA/EMC) • UAS consist of the aircraft, communications, and control/support systems • Many different platforms, each having different flight and payload capabilities • NOAA UAS Program • Fill in existing data gaps • Improve forecasting of tropical cyclones and atmospheric river events • Climate monitoring in the Arctic and Atlantic • Fisheries monitoring and enforcement
Regional OSSEs to Evaluate ATMS and CrIS Observations • M. Hill, P. J. Fitzpatrick, X. Fan, V. Anantharaj, • M. Masutani, L. P. Riishojgaard, and Y. Li • GRI/Mississippi State Univ (MSU), JCSDA
Other OSSEs planned or considered Seeking funding but start with volunteers OSSEs for THORPEX T-PARC Evaluation and development of targeted observation Z. Toth, Yucheng Song (NCEP) and other THORPEX team members Data assimilation for climate forecasts H. Koyama, M. Watanabe (University of Tokyo) OSSE to evaluate data assimilation systems It is worthwhile to try identical twin experiments to understand model error. ECMWF and GMAO Assimilation with LETKF possibly by 4D-var T. Miyoshi(UMD) and Enomoto(JEMSTEC) Analysis with surface pressure Gil Compo, P. D. Sardeshmukh (ESRL) Data assimilation with RTTOVS Environment Canada Y. Rochen Sensor Web Uses same Nature Run NASA/GSFC/SIVO, SWA , NGC Visualization of the Nature run O. Reale (NASA/GSFC/GLA), H. Mitchell(NASA/GSFC/SIVO) Regional DWL OSSEs Zhaoxia Pu, University of Utah
Summary • OSSEs are a cost-effective way to optimize investment in future observing systems • OSSE capability should be broadly based (multi-agency) • Credibility • Cost savings • Joint OSSE collaboration remains only partially funded but appears to be headed in right direction • GMAO software to calibrate basic data is ready for release • Additional software being developed at NCEP, NESDIS, ESRL and GMAO • Database and computing resources have been set up for DWL simulation and SWA; KNMI receiving ESA funding for DWL simulations • Preliminary versions of some basic datasets have been simulated for entire T511NR period
Using Full OSSE, various experiments can be performed and various verification metrics can be tested to evaluate data impact from future instruments and data distributions. It was noted that that while OSSEs can be overly optimistic about the impacts of new observations evaluated in the current data assimilation system, advances in data assimilation skill usually allow us to make better use of observations over time. These advances may, to some extent, be an offsetting factor in that they can help achieve greater impact from new observations in the long run. (From ECMWF Workshop summary) Theoretical predictions have to be confirmed by full OSSEs. The results are often unexpected. OSSE results also require theoretical back ups. OSSE capability should be broadly based (multi-agency) to enhance credibility and to save costs.
NOAA is looking at a broad range of UAS platforms to fill data gaps…….. Slide courtesy of Sara Summers
DWL OSSE using Old T213 Nature Run at NCEP D2+D3: Red: upperDWL + LowerDWL D1: Light Blue closed circle: Hybrid DWL (D1) with scan, rep error 1m/s R45: Cyan dotted line triangle: D1 with rep error 4.5m/s (4.5x4.5≈20) U20: Orange: D1 uniformly thinned for factor 20 (Note this is technologically difficult) N4: Violet: D1 Thinned for factor 20 but in forward direction 45,135,225,315 (mimicking GWOS) S10: Green dashed: Scan DWL 10 min on, 90 min off. No other DWL D4 : Dark Blue dashed: non scan DWL Hybrid-DWL has much more impact compared to non-scan-DWL with the same amount of data. If the data is thinned uniformly, 20 times thinned data (U20) produces 50%-90% of impact. 20 times less weighted 100% data (R45) is generally slightly better than U20 (5% of data). Four lidars directed 90 deg apart (N4) showed significant improvement over D4 only at large scales over SH but is not much better over NH and at synoptic scales. Without additional scan-DWL, 10min on 90 off (S10)sampling is much worse than U20 (5% uniform thinning) with twice as much as data. NH V500 Zonal wave number 10-20 The results will be very different with newer assimilation systems and a higher resolution model.
Simulated NOAA 15 Observed N15+N16 Simulated NOAA 16 AMSUA May 2 00z (NCEP-NESDIS) Real data are plotted for all footprints. Simulated data are plotted for footprints used in NCEP GDAS.