
Research Methods: Exploring Theory and Hypothesis in Public Administration
E N D
Presentation Transcript
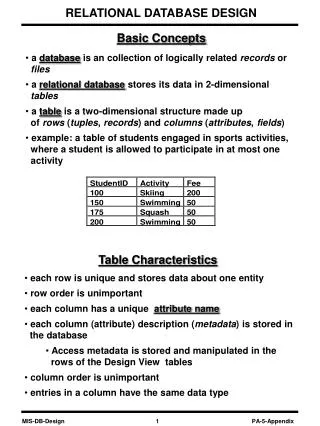
Basic Concepts Research Methods for Public Administrators Dr. Gail Johnson Dr. G. Johnson, www.researchdemystified.org
Social Science • At its simplest, the elements of pure science: • Chance occurrence • Observant/inquisitive mind: I wonder why? I wonder if? • Deduction of the principles • Testing those principles • Of course, it is more complex but this is its essence Dr. G. Johnson, www.researchdemystified.org
Secret Language of Science • Theory • Hypothesis • Variable • Values Dr. G. Johnson, www.researchdemystified.org
Theory • Used to explain reality or determine why things happen. • Developed by using the scientific method: the observation and deducing the underlying principles. • Proven theories tell us “why” people do what they do or organizations act they way they do. • The law of supply and demand Dr. G. Johnson, www.researchdemystified.org
Theory • Proven theories enables you to make predictions. • If we increase health prevention programs, there will be a reduction in preventable childhood diseases • Untested theories might be considered beliefs. Dr. G. Johnson, www.researchdemystified.org
Theory In the News • Equilibrium theory: belief an unconstrained market will reach equilibrium because of the balance of various forces. This is the invisible hand that will make everything okay. • One fundamental belief is that market values change only in response to new information. • Mark Buchanan, “This Economy Does Not Compute,” New York Times, October 1, 2008. Dr. G. Johnson, www.researchdemystified.org
Hypothesis • A conjecture put forth as a possible explanation of certain relationships • A statement that specifies the relationship between variables. • If we fund welfare to work programs, we expect that it will move 75% of the people off welfare. • Serves as the basis for experimentation by which to reach the truth. • If we give banks $700 billion, then they will extend credit to homeowners and small businesses thus reducing foreclosures and economic collapse in small towns. Dr. G. Johnson, www.researchdemystified.org
Hypothesis • Your best guess about how various factors are related based on a theory. • A testable assumption based on a theory. • If X is true, then Y should be true. • If we train the chronically unemployed, then they will be more likely to obtain jobs. Dr. G. Johnson, www.researchdemystified.org
Examples of Familiar Hypothesis A. If Max Weber is correct, then the more hierarchical and bureaucratic an organization is, then the more efficient and effective it will be. B. If Weber is correct, then the more bureaucratic an organization is, the less personal likes and dislikes will be present. Dr. G. Johnson, www.researchdemystified.org
Hypothesis: Examples C. If adult theory is correct, then adults in learning environments that are highly interactive and hands-on will learn more than adults in traditional, passive, lecture classes. D. Other examples?? Dr. G. Johnson, www.researchdemystified.org
Equilibrium Theory Tested • Hypothesis: If there a relationship between financial news stories and market activity, then we should see greater changes in market activity immediately following a major financial story. Dr. G. Johnson, www.researchdemystified.org
Variable and Values Variable: • Observable characteristics • Eg. Race, gender, income, IQ scores, employee satisfaction Values: • Categories of the variable • Eg. Male or Female, dollar amount Dr. G. Johnson, www.researchdemystified.org
Variables and Values Variable Values Gender Male Female Job Satisfaction Very Satisfied- to- Very Dissatisfied Scale Annual Salary Actual Dollar Amount Dr. G. Johnson, www.researchdemystified.org
Variables Race: Education: Education: Values White, Black, African-American, Hispanic, Asian, Multi-racial, Other Number of years completed: 8, 9, 10, 11, 12, 13, 14, 154, 16, 17, 18+ Highest degree completed High school, Associates, some college, BA/BS, Masters, PhD, MD, JD What are the Values? Dr. G. Johnson, www.researchdemystified.org
Level of Measurement • Nominal Data: • Values consists of names or categories. • There is no order: one is not more or less than the other, better or worse. • Gender: (male/female) • Religion (Christian, Jewish, Buddhist, Muslim, Other) • Country of Origin • Branch of the Military Dr. G. Johnson, www.researchdemystified.org
Level of Measurement • Ordinal Data: Values have an Order • Income categories: low income, middle income, high income) • Highest degree completed: less than high school, completed high school, college graduate, advanced degree (MPA, JD, PhD). • Opinion scales (Likert Scales): How satisfied or dissatisfied (scale of 1-5); Do you agree or disagree (scale of 1-5). These are not real numbers but conceptually reflect an order from low to high. Dr. G. Johnson, www.researchdemystified.org
Level of Measurement • Interval Data: • The values are numbers of equal distance but do not contain a zero. • SAT, GRE and IQ scores are interval data. • Ratio Data: • The values are real numbers with a zero point. • Income in dollars, weight, years of education completed, number of inches of rain are ratio data. Dr. G. Johnson, www.researchdemystified.org
Level of Measurement • Interval and Ratio Data are treated the same way when analyzed. • I tend to refer to both as “real numbers”, as compared to ordinal and nominal data. • Ordinal and nominal are analyzed differently. • You can average real numbers, but you can’t average nominal or ordinal data. Dr. G. Johnson, www.researchdemystified.org
Causation/Causality • Four elements are needed: • Logical Theory (to explain why the variables should be related) • Time order (the causal variable must come first) • Co-variation (as the causal variable increases or decreases, the other variable should also change • No Rival Explanations: All other possible explanations must be eliminated Dr. G. Johnson, www.researchdemystified.org
Independent and Dependent Variables Time Order: • Independent Variable (IV): the Changer Has to Happen Before • Dependent Variable (DV): the Changed Has to Happen After Dr. G. Johnson, www.researchdemystified.org
Independent and Dependent Variables • Independent Variable (IV): • Explains the changes • The variable that causes change (the changer) • Dependent Variable (DV): • The variable being explained or changed • May also be called outcome or effect Perceived Salary Equity Employee Satisfaction Dr. G. Johnson, www.researchdemystified.org
Pay Equity Satisfaction? • Of those who feel they are paid equitably, 85% report being satisfied with their job. • In contrast, of those who feel they are not paid equitably, 35% report being satisfied with their job. Dr. G. Johnson, www.researchdemystified.org
Example Hypothesis: As Age Increases, Health problems Increases Health Problems Age IV DV Dr. G. Johnson, www.researchdemystified.org
Example Do high GRE scores predict academic success as measured by GPA? It would be depicted like this: GRE Scores GPA DV IV Dr. G. Johnson, www.researchdemystified.org
Example Do women earn less than men? Hypothesis: If you are a woman, you are more likely to earn less than a man doing similar work. Gender explains differences in Income. Gender Income DV IV Dr. G. Johnson, www.researchdemystified.org
Is it always that simple? No • Could there be something else that affects earnings besides gender? • Maybe it is level of education. • We could “control” for education, by looking at the income of men and women and at different education levels, and then see if there is a still a difference based on gender. Dr. G. Johnson, www.researchdemystified.org
Control Variable • A third variable that affects or even changes the initial relationship between the independent and dependent variables • Eg. Does gender make a difference in the initial relationship between perceived salary equity and employee satisfaction? • Put another way: Are men more likely to be dissatisfied with pay inequity then women? • Gender is a control variable in this example. Dr. G. Johnson, www.researchdemystified.org
Control Variable • For men, of those who feel they are paid equitably, 70 percent report they are satisfied with their job. Of those men who feel they are not paid equitably, 20 percent report being satisfied. • For women, of those who feel they are paid equitably, 90% report they are satisfied with their job. Of those women who do not feel they are paid equitably, 55% report being satisfied. Dr. G. Johnson, www.researchdemystified.org
Control Variable • Conclusion? Pay equity is less a factor in job satisfaction for women as compared to men. • This is one way a control variable might work to reveal deeper insights. Dr. G. Johnson, www.researchdemystified.org
Control Variable • Variables might initially appear to be related but there is another variable that actually is the real explanation. . Dr. G. Johnson, www.researchdemystified.org
Uncovering Bogus Relationships • As ice cream sales increase, the number of downings also increase. • Does ice cream cause drownings? • Maybe something else—like warm tempertures—explains increases in ice cream sales and drownings. • Controlling for a third variable: • When temperature is controlled for (this is the control variable), the initial relationship disappears. The initial relationship is called spurious (or bogus). Dr. G. Johnson, www.researchdemystified.org
Uncovering New Relationships • Two variables may appear not to be related by when a control variable is added, a relationship emerges. • For example, there may be no discernable music preferences among people based on income but when education is used as a control variable, it may turn out that there are noticeable differences in music preferences. Dr. G. Johnson, www.researchdemystified.org
Direction of Relationships Direct Inverse Non-linear Dr. G. Johnson, www.researchdemystified.org
Direct Relationships • Both variables change in the samedirection • As age increases, health problems increases • As GRE increases, GPA increases • As calorie intake decreases, weight decreases Dr. G. Johnson, www.researchdemystified.org
Inverse Relationships • Variables change in the oppositedirection • As age increases, memory decreases • As skills increase, errors decrease • As family income decreases, the incidence of teen births increases Dr. G. Johnson, www.researchdemystified.org
Non-linear relationships • Changes in the dependent variable goes both up and down. • As age increases, income increases, until age 60; After age 60, income decreases • Drug use is higher among youth from low income families and high income families, but lower among middle income families. Dr. G. Johnson, www.researchdemystified.org
Independent and Dependent Variables Can Switch Hypothesis: as poverty increases, teen birth rates increase. • Independent variable: poverty in a community. • Dependent variable: teen birth rates. Dr. G. Johnson, www.researchdemystified.org
Independent and Dependent Variables Can Switch Hypothesis: As teen birth rates in a community increase, the poverty in a community increases. • Independent variable: teen birth rates. • Dependent variable: poverty in a community. Dr. G. Johnson, www.researchdemystified.org
Relationships • Key Point: Independent and dependent variables are related to the context. • Determining which variable is causal in the context is often a judgment call. Dr. G. Johnson, www.researchdemystified.org
Relationships Death rates in car accidents are higher in less densely populated areas. Independent: Population density measured as number of people/sq. mile or as high, medium, low Dependent: Death rates in car accidents as measured by the number/1000 miles driven Direction of the relationship: inverse. Dr. G. Johnson, www.researchdemystified.org
Takeaway Lesson • Research methods is like learning a foreign language. • The concepts will really will become clearer as we work our way through this material. • Remember, you have mastered difficult material before; this is no different. • As in life, patience and perseverance help. Dr. G. Johnson, www.researchdemystified.org
Creative Commons • This powerpoint is meant to be used and shared with attribution • Please provide feedback • If you make changes, please share freely and send me a copy of changes: • Johnsong62@gmail.com • Visit www.creativecommons.org for more information Dr. G. Johnson, www.researchdemystified.org