Download
1 / 1
10 likes | 130 Views
Freshwater Variability on the Gulf of Alaska Shelf [ OS42A-01 ] Geoffrey Irving 1 , Thomas J. Weingartner 1 (weingart@ims.uaf.edu), Thomas C. Royer 2 (royer@ccpo.odu.edu), Stephen R. Okkonen 1 , and David L. Musgrave 1

E N D
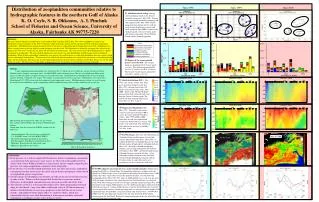
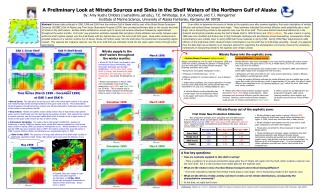
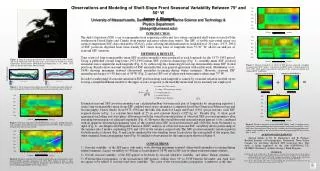
Freshwater Variability on the Gulf of Alaska Shelf[OS42A-01] Geoffrey Irving1, Thomas J. Weingartner 1 (weingart@ims.uaf.edu), Thomas C. Royer2(royer@ccpo.odu.edu), Stephen R. Okkonen1, and David L. Musgrave1 1Institute of Marine Science, University of Alaska, Fairbanks, AK 99775-7220; 2Center for Coastal Physical Oceanography, Old Dominion University, Norfolk, VA 23529 LONG-TERM MONITORING IMPLICATIONS Sea level anomalies are correlated with dynamic height and vertically integrated salinity anomalies at GAK1. The results are encouraging because the GAK1 data are based on a single vertical profile taken monthly while the sea level data are collected hourly (at least). The relationships might improve with more frequent sampling at GAK1. We are presently measuring GAK1 salinity hourly and year-round at several depths so that such a test can be made. Perhaps sealevel could provide an index of low-frequency freshwater variations on the Gulf of Alaska shelf. INTERANNUAL AND INTERDECADAL VARIABILITY Figure 4. 19-month running means of monthly discharge anomalies (computed following Royer, 1982) and the Pacific Decadal Oscillation (PDO). The coherence (not shown) between the unsmoothed series is significant at the 95% level at periods of 2-3 years with PDO leading discharge by ~6 months and explaining ~60% of the discharge variance at the 2-3 year period. The results also suggest strong coherence at periods >10 years although the discharge record is not long enough to resolve (statistically) the relationship at very low frequencies. Note also that: 1.) Interdecadal differences are similar in magnitude to interannual variations. 2.) There was low discharge and negative PDO from ~1950 - 1980 and high discharge and positive PDO from 1935 - 1950. The mid-1970 transition from negative to positive discharge and PDO coincides with the “regime shift” (Mantua et al., 1997). Figure 5. Time amplitude function for the 1st EOF mode of streamflow discharge for the rivers in Figures 1 C, D. In both cases the first mode captures the decline in discharge from 1959 to the mid-1970s and the rise thereafter. Thus the streamflow results are consistent with those shown in Figure 4. INTRODUCTION Salinity controls the horizontal and vertical density gradients and therefore circulation and mixing on the Gulf of Alaska shelf. Consequently, changes in freshwater content and distribution could significantly influence this shelf ecosystem. Quantifying variations in salinity (or freshwater forcing) is difficult here because the measurement network is sparse and there are few continuous long-term measurements of ocean salinity, precipitation, and/or coastal discharge from around the gulf. Our goals here are twofold: I. Illustrate salinity (or freshwater) variations on seasonal and longer time scales. Quantifying this variability is critical for an understanding of how climate changes could affect this marine ecosystem. II. Show consistency in interdecadal variations among diverse data sets from around the gulf. The data sets and their locations (shown in Figure 1) include: 1.) 30 (gappy) years of nominally monthly CTD data from hydrographic station GAK 1 and sea level from Seward, Alaska and ~40 cruises (since 1980) along the Cape Fairfield Line in the northern Gulf of Alaska (Figure. 1A). This line encompasses the bulk of the Alaska Coastal Current (Johnson et al., 1988; Stabeno et al., 1995). 2.) ~40 years of monthly atmospheric precipitable water obtained from the NCEP/NCAR reanalyzed meteorological fields on a 2.5o grid between 65o-35oN and 160o-120oW (Figure 1B). 3.) 40 to 50 years of monthly USGS discharge records from streams entering the north central and eastern gulf (Figure. 1C,D). We use normalized monthly anomalies of the discharge since the drainage basins vary from 20 and 70000 km2. 4.) 70 years of coastal surface salinity data from British Columbia archived by Canada’s Dept. Fisheries and Oceans (Figure. 1D). Figure 5 Figure 4 Figure 1 Figure 9. SEASONAL AND INTERANNUAL VARIABILITY Figure 2 shows the mean annual cycle of: 1) coastal discharge into the Gulf of Alaska (Royer, 1982), the upwelling index, and 2) salinity at GAK 1. Downwelling winds are a maximum in winter and discharge is a maximum in fall. Deep and surface salinities are out-of-phase. Runoff dilutes the upper ocean in summer and fall, while high salinity slope water floods the shelf bottom as winds relax in summer. The annual salinity range is a minimum at 75 and 100m so we use these depths for computing transports and freshwater content. Figure 3 shows the:A) alongshore baroclinic transport, B) freshwater content, and C) freshwater transport (baroclinic component). Transports are referenced to 75 db between 4 and 30 km offshore with westward transport negative. Freshwater content is expressed as a height upon integrating vertically (dz) and across shore (dy). The mean Gulf of Alaska basin salinity is the reference salinity (Sr=34.42). The results are highly variable but suggest that: 1.) Baroclinic transport [Figure 3A] increases twofold and freshwater transport [Figure 3C] increases fivefold between spring and fall with both in-phase with the discharge cycle (Figure 2). 2.) The baroclinic component of the mean annual freshwater transport in the 0-75m layer is ~400 km3-yr-1 (twice the mean annual Yukon River discharge). 3.) Freshwater content [Figure 3B] remains constant from July though November although discharge doubles rapidly during this time. This means that ocean dispersal processes are removing freshwater from the upper 75m of the inner shelf. Table 1 compares salinity, baroclinic transport, and freshwater transport in the Alaska Coastal Current between early spring 1998 and 1999. The differences are remarkable. For example, the freshwater transport difference is comparable to the mean discharge of the Columbia River! The low salinity waters in 1998 were more strongly stratified and accompanied by shelf NO3 concentrations 30 – 50% lower than those of 1999. These differences could influence primary productivity rates and patterns. The differences arose because in 1998 cyclonic winds were stronger in the eastern gulf and there was greater fall and winter discharge into the gulf than in 1999. CONCLUSIONS 1. Variations in freshwater forcing and the baroclinic transport of freshwater is large on seasonal, interannual, and interdecadal time scales. Freshwater transport increases fivefold between spring and fall and its transport by the Alaska Coastal Current in spring 1998 was twice that of spring 1999. 2. The alongshore baroclinic transport in the upper 75m of the water column and within 30 km of the coast carries about 50% of the total coastal discharge into the Gulf of Alaska. 3. Coastal discharge estimates based on Royer’s (1982) method , measured discharge, the leading EOF of precipitable water over the Northeast Pacific Ocean, and coastal salinity data all suggest a decrease in freshwater discharge into the northern Gulf of Alaska from the late 1950s through the mid-1970s. Discharge increased from the mid-70s through the early-80s; coincident with the regime shift of the 1970s and with the PDO Index (Mantua, 1997; Overland et al., 1999). These findings add to other suggestions of a freshening across the North Pacific Ocean basin since the 1970s (Wong et al., 1999). 4. Monthly sea level anomalies at Seward Alaska are significantly correlated with monthly anomalies of vertically integrated (0-200m) salinity and the 0/200db dynamic height. Hence sealevel could serve as a proxy for shelf salinity variations here and perhaps elsewhere in the Gulf of Alaska. REFERENCES Freeland, H. J., K. L. Denman, C.S. Wong, F. Whitney, and R. Jacques. Evidence of change in the winter mixed layer in the northeast pacific Ocean, Deep-Sea Res., 44, 2117-2129, 1998. Johnson, W. R., T.C. Royer, and J. L. Luick, On the seasonal variability of the Alaska Coastal Current, J. Geophys. Res.,93, 12423-12437, 1988. Mantua, N., J., S.R. Hare, Y. Zhang, J. M. Wallace, and R. C. Francis, A Pacific Interdecadal Climate Oscillation with Impacts on Salmon Production, Bull. Am. Met. Soc., 78, 1069-1079, 1997. Overland,J.E., S. Salo, and J.M. Adams, Salinity signature of the Pacific Decadal Oscillation, Geophys. Res. Lett., 26, 1337-1340, 1999. Royer, T. C., Coastal freshwater discharge in the Northeast Pacific, J.Geophys. Res., 87, 2017-2021, 1982. Stabeno, P.J., R. K. Reed, and J. D. Schumacher, The Alaska Coastal Current: coninuity of transport and forcing, J. Geophys. Res., 100, 2477-2485, 1995. Wong A.P.S., N. L. Bindoff, and J. A Church, Large-scale freshening of the intermediate waters in the Pacific and Indian Oceans, Nature, 400, 440-443. ACKNOWLEDGEMENTS G. Irving was supported by an NSF-REU to T. Weingartner. T. Weingartner was supported by the Exxon Valdez Oil Spill Trustees Council and with NSF and NOAA support under GLOBEC. T. Royer was supported by the GLOBEC program. Figure 6. Figure 2. Figure 3. Figure 8. Figure 7. INTERANNUAL AND INTERDECADAL VARIABILITY Figure 6 is the time amplitude function of the 1st EOF mode of precipitable water over the Northeast Pacific Ocean which shows a decrease in atmospheric water from ~1960 to the mid-1970s and then a rapid increase through the early 1980s. This pattern is consistent with those of Figures 4 and 5. The eigenvector for this mode (Figure 7) shows that the maximum amplitude is in the northeast Gulf of Alaska. Coastal surface salinities along British Columbia (Figure 8) the spatial and temporal pattern of this EOF. Langara, the farthest north coastal station in British Columbia, shows increasing salinities from the late 1960s through the mid-1970s and a decrease thereafter. This did not occur at the coastal sites further south, where the amplitude of this EOF mode is much smaller (Figure 7). Note though that all the coastal data suggest a freshening trend (since at least the 1930s) along the British Columbian coast [Freeland et al., 1997]. That trend is not reflected in the discharge time series (Figure 4) however. Although the causes and geographical extent of this trend is unknown, although it is not evident in the Gulf of Alaska discharge data (Figure 4). But because these waters feed the Alaska Coastal Current the freshening trend might also exist in the northern gulf.