Download
1 / 67
670 likes | 697 Views
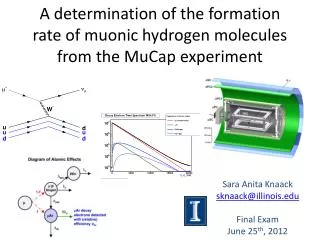
Explore the measurement of muon capture rate by the proton, importance of gP pseudoscalar form factor, and MuCap mission and method.

E N D
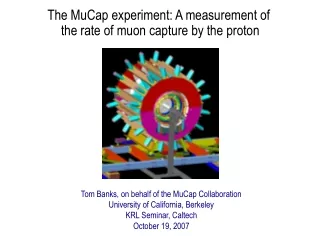
The MuCap experiment: A measurement of the rate of muon capture by the proton Tom Banks, on behalf of the MuCap Collaboration University of California, Berkeley KRL Seminar, Caltech October 19, 2007
The reaction • Semileptonic, weak interaction process • Fixed momentum transfer νμ n q0 W μ p
Current structure ν d μ u • The leptonic and quark currents in muon capture possess the simple V-A structure characteristic of the weak interaction
The hadronic current ν n μ p • But muon capture involves nucleons, not isolated quarks! • The QCD substructure of the nucleon complicates the weak interaction physics • QCD effects are encapsulated in the charged-current’s four “induced form factors”
gV = 0.976(1) gM = 3.583(3) gA = 1.247(4) gP = 8.26, 8.7, 10.6, 12.2, …? The pseudoscalar form factor • The pseudoscalar gP is by far the least well known of the form factors • Modern theories make relatively precise (3%) predictions for gP … • … but experimental results for gP are inconsistent with each other and theory. values and q2-dependence known from EM form factors via CVC value known from β–decay; q2-dependence known from neutrino scattering
Theoretical predictions for gP ν n W π μ p • Pion pole is dominant contributor to the pseudoscalar form factor • PCAC yielded an expression for the pseudoscalar more than 30 years ago: • Modern chiral perturbation theories (ChPT), which are low-E effective QCD, reproduce the PCAC result in systematic expansions • Present-day heavy baryon ChPT (HBChPT) predicts gP(q02) = 8.26 ± 0.23
Options for measuring gP • The pseudoscalar form factor participates in any process involving the nucleon’s charged current: • beta decay • neutrino scattering • pion electroproduction • muon capture • Muon capture is the most attractive because of its • large momentum transfer • comparative ease of measurement • model-independent connection to gP • Muon capture offers a unique probe of the nucleon’s electroweak axial structure
Muon capture experiments • Ordinary muon capture (OMC) in hydrogen: • branching ratio ~ 10–3 • > 5 neutron counting measurements • 1 muon lifetime measurement • Radiative muon capture (RMC) in hydrogen: • variable momentrum transfer → more sensitive to pion pole than OMC • branching ratio ~ 10–8 • only 1 measurement, counted photons > 60 MeV • Muon capture in nuclei (helium, …)
Muon capture measurements in hydrogen • Variety of experiments, using liquid and hydrogen targets • Plotting the reported gP values this way is somewhat misleading, as the extraction of gPdepends upon assumptions about hydrogen kinetics…
μp↑↓ μp↑↑ pμp pμp μ μZ Muon kinetics in hydrogen triplet ortho para singlet • Negative muons in pure hydrogen form a variety of atomic and molecular states • Contamination from Z>1 elements introduces yet more pathways
μp↑↓ μp↑↑ pμp pμp μ μZ Muon kinetics in hydrogen triplet ortho para singlet • Each muonic state has a unique nuclear capture rate • The measured capture rate is some combination of contributing rates • Many of the important kinetics rates are poorly known
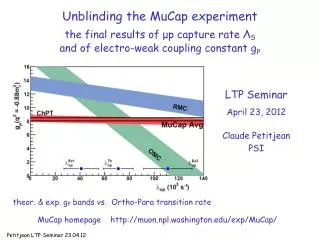
Knowledge of gP prior to MuCap • Interpretation of muon capture experiments depends upon poorly known molecular kinetics — namely, the transition rate λop. • No way to reconcile theory with both RMC and OMC experiments! • HBChPT makes precise prediction for gP→ opportunity to test our understanding of role of chiral symmetries in QCD
Mission • We seek to measure the rate of nuclear muon capture by the proton, by stopping negative muons in hydrogen gas and observing the time spectrum of decay electrons.
Apparatus • Muon detectors • μSC: fast timing of muon arrivals • μPC1,TPC: 3D tracking of incoming muon trajectories • Electron detectors • ePC1, ePC2: 3D tracking of outgoing electron trajectories • eSC: fast timing of outgoing decay electrons
Method: “Lifetime technique” e― Data Acquisition Telectron H2 μ― Tmuon DT log(counts) • Fill histogram with muon’s lifetime ΔT • Repeat N times for a 1/√N precision lifetime measurement: DT
Method: “Lifetime technique” log(counts) muon decay time • Negative muons can disappear via decay or nuclear capture • Positive muons can only decay • The muon capture rate can be obtained from the small (0.16%) difference between the disappearance rates (i.e. inverse lifetimes) of the two species:
μp↑↓ μ What about problematic kinetics? μp↑↑ triplet pμp pμp ortho para singlet μZ • We use an ultra-pure, low-density (1% of LH2) hydrogen gas target, where muons primarily reside in the hyperfine singlet ground state of the μp atom • Most nuclear captures (96%) proceed from the singlet state:
Hydrogen target • The gaseous hydrogen target is an optimal compromise among competing demands: • suppression of μp triplet and pμp molecule formation • minimization of μp diffusion • preservation of substantive muon stopping power • The TPC plays a critical role…
Active (& Novel!) hydrogen target Time Projection Chamber (TPC) • TPC sits in pressure vessel filled with 10-bar, ultra-pure hydrogen gas (protium) • Protium gas is both muon stopping target and chamber gas • TPC provides three-dimensional tracking of incoming muons, thus enabling identification of “clean” muon stops • TPC is constructed of bakeable materials (quartz, ceramic)
Precision goals 1010μ− decay events in pure hydrogen gas(cZ < 10 ppb, cd < 1 ppm) 10 ppm measurement of μ− disappearance rate 1% determination of ΛS 7% determination of gP
Experiment location MuCap is conducted in the “ExperimentierHalle” at the Paul Scherrer Institut (PSI), in Villigen, Switzerland.
PSI experimental hall facilities Muon Source • PSI accelerator (ring cyclotron) generates 590 MeV proton beam (v ~ 0.8c) • protons strike a spinning graphite target and produce pions • pions decay to muons Muon Beam Properties • μ+ or μ– selectable • Momentum ~ 30-40 MeV/c • Max intensity ~ 50 kHz
Beamline Overhead view of the MuCap detector in the πE3 beamline at PSI.
2004 data collection • 2004 run was our first opportunity to collect good physics data: • All major detectors were installed (ePC2 was last to be added) • Material budget along muon path reduced → scattering reduced → muon stopping fraction in TPC doubled (30% → 60%) • New CHUPS recirculation system continuously removed Z>1 impurities from the hydrogen gas • Reliable, fast DAQ • We recorded approximately 1.6 x 10⁹ good μ− decay events in purified hydrogen • We also performed several impurity-doped calibration measurements
2004 data collection MuCap detectors assembled at PSI, October – November 2004.
2004 data collection MuCap detectors assembled at PSI, October – November 2004.
2004 data collection ― CHUPS gas cleaning system • CHUPS:Continuous Hydrogen Ultra-Purification System • Developed by colleagues at PNPI, Gatchina, Russia • Suppressed Z>1 impurities orders of magnitude below previous levels • Recently published in V. A. Ganzha et al., NIM A578 (2007) 485
Identifying muon stops in the TPC x y,t muon stop (Bragg peak) z y,t muon entrance (low energy loss)
Identifying muon stops in the TPC • Drift time of a muon track in the TPC is given by TTPC − TμSC • Drift time ↔ muon stopping position in the TPC • Gaussian shape of drift distribution comes from muon beam profile
Muon pileup effects Problem: accidentals in TPC drift distribution lead to nonuniform accidentals in lifetime histogram Solution: impose a 25 μs veto on muon arrivals (“pileup protection”)
The lifetime histogram • The signal-to-background ratio of the lifetime histogram is enhanced by • imposing a ± 25 μs veto on muon pileup • requiring coincident hits in all 3 electron detectors • imposing an “impact” cut on the muon/electron vertex
Fit function • The muon disappearance rate is obtained by fitting the measured decay spectrum with an exponential function,
Cosmics • Cosmics contribute to the lifetime spectrum’s uniform background • Fit background varies sinusoidally around eSC, as expected from cosmics • We simply adjust the lifetime histogram’s bin errors to correct for cosmics • double-counting, thereby improving the fits’ χ2
Fitted rate vs. time during run χ2/d = 101.6/98 = 1.04 ± 0.14
Fitted rate • Result for the fitted μ– disappearance rate: • However, in reality the lifetime spectrum is not a pure exponential, and
μp↑↓ μp↑↑ pμp pμp μ μZ Corrections: Captures by Z>1 gas impurities triplet ortho para singlet • Muons preferentially transfer to Z>1 impurities in the hydrogen gas (transfer rates λpZ ~ 1010 – 1011 Hz; λof ~ 106 Hz) • Ensuing nuclear captures distort the lifetime measurement (for C,N,O, ΛZ ~ 40 – 100 kHz, whereas ΛS ~ 0.7 kHz) • Circulation system did a great job of suppressing impurity levels in 2004, but there was still nonnegligible level of contamination (~ 50 ppb O from humidity)
Corrections: Captures by Z>1 gas impurities • The TPC can detect a fraction of Z>1 nuclear captures!
Corrections: Captures by Z>1 gas impurities • Effect of impurities on the lifetime is proportional to the capture yield Y, the number of observed TPC captures per good muon stop • Proportionality for contaminants N,O is established by calibration measurements • Capture-yield-based correction is:
Corrections: Muon scatters into Z>1 materials muon scatter signature • Sometimes a muon scatters off a proton, mimicking a stop in the TPC • Scatter events are dangerous because the scattered muons can stop in surrounding Z>1 detector materials • We can catch some of these events, but the signature is not always robust
Corrections: Muon scatters into Z>1 materials • Differential study of scatter events indeed exhibits a higher disappearance rate: • Unfortunately, we must rely on simulations to estimate our identification efficiency • We remove the scatters we find, and conservatively assume ~ 50% inefficiency:
Corrections: Deuterium (μd diffusion) μd μp 1 mm • Muons preferentially transfer from μp → μd • H2 gas is more “transparent” to μd atoms, so they diffuse faster = farther • The rapid diffusion can raise the observed muon disappearance rate in two ways: • muons can diffuse out of the decay vertex reconstruction radius • muons can diffuse into surrounding detector materials and capture there
Corrections: Deuterium (μd diffusion) λ Production Data Deuterium-doped data Δλμd cd (ppm) 122(5) Extrapolated Result 0 1.44(13) • We perform a zero-extrapolation to correct for the effects of μd diffusion
Corrections: Deuterium (μd diffusion) • The deuterium concentrations were determined using two complementary methods: • External measurements of gas samples • From data analysis of the λ vs. impact parameter dependence: • The results from the two approaches were consistent • The zero-extrapolation yields:
Corrections: μp diffusion • Although μp diffusion distances are small (~ 1 mm), the scattering of outgoing decay electrons by the aluminum pressure vessel magnifies the behavior • By combining the electron scattering distribution (i.e. the impact parameter distribution) with a simple model of isotropic μp diffusion, we calculate: