GEOLOGY FOR NON GEOLOGIST PRESENTATION
510 likes | 980 Views
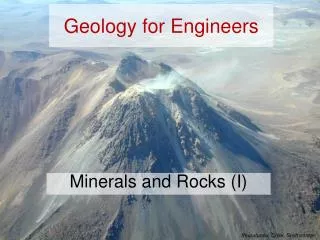
GEOLOGY FOR NON GEOLOGIST PRESENTATION. Gold occurrence in the Greenstone belts. Definition : Greenstone Belt

GEOLOGY FOR NON GEOLOGIST PRESENTATION
E N D
Presentation Transcript
Gold occurrence in the Greenstone belts • Definition :Greenstone Belt • These are zones originally occupied by Fe rich volcanic rocks – basalt and other volcanics- which are later metamorphosed/changed to form a greenish rock assemblage. The term green in this context is derived from the presence of green minerals (Actinolite, amphiboles, epidote, chlorite and serpentine among others). They invariably contain sedimentary rocks and are surrounded by low Fe high silica containing granite-gneissic rocks. • Occurrence • About 6% of Zimbabwe is covered by the greenstone belts which has general stretch along the south-west to North East trend parallel to the great Dyke in the central portion of the country. These zones are flanked by high silica low Fe rich rocks ~granite-gneissic rocks. Their existence could be apportioned to Fe-rich volcanic rocks e.g. basalts, gabbros and other related volcanics which later undergo a process of metamorphism thereby concentrating Au-rich rock along fracture or shear zones - remobilization of fluids along shear zones later regarded as mineralized ore shoots.
The Geology of Gwanda greenstone belt • Gwanda greenstone belt is found on the southern side of Bulawayo about 126km. It comprises like any other green stone belt of supra crustal metavolcanics which can best be equated to those found in the Abitibi of Canada and the Barberton of south Africa. This suit is one of the largest gold producers in Zimbabwe which was once hosting not less than 268 operating mines though this figure is progressively diminishing due to other constraints affecting any other mining activities across the country. This suit is 70Km long by 15km wide and it host Blanket Mine and it’s current satellite mines (GG and Mascot) and the nearby Vubachikwe mine currently run New-dawn group of mines as well as the Jessie mine to the southeastern end of the belt. • Geological setting of Blanket Mine • Blanket Mine is part of the group of mines that make up the North Western Mining camp otherwise also called the Sabiwa group of mines. What is today referred to, as Blanket Mine is a cluster of mines extending from Jethro to the south, through Blanket itself, the currently defunct Feudal, AR South, AR Main, Sheet, Eroica and Lima. In addition dormant old showings include Sabiwa from the south, Jean, Provost, Redwick, Old Lima, and Smiler. This later group of mines is the northern continuation of the Vubachikwe hosting banded iron formations. • The local geology consists of a basal felsic unit of no known mineralisation showing. It is generally on this litho logy that the tailings disposal sites are located. Above this unit is the ultramafics that include the banded iron formations hosting the eastern dormant cluster and the ore bodies of the nearby Vubachikwe complex. The active Blanket ore bodies are found on the next unit, the mafics. An andesitic unit caps this whole stratigraphy. A regional dolerite sill cuts the entire sequence from Vubachikwe through Blanket to Smiler. • Ore bodies at Blanket are epigenetic. They are associated with a later regionally developed deformation zone characterized by areas of high strain wrapping around relatively undeformed remnants of the original basaltic flows. It is within the higher strain regime that the wider of the ore bodies are located.
Diamond Drilling • Diamond drilling for coring purposes is carried out both underground and on surface. • Large surface machines powered by diesel engines can drill holes up to 150mm in diameter and over 4000m in length. Core is recovered in a core barrel (conventional method) or pulled out through the rods (wireline method). These machines can be adapted for use underground when exploration projects are being undertaken. • Underground machines for routine work are smaller and lighter. They can be powered by compressed air (pneumatic), water (hydraulic) or electricity. Core is of smaller diameter (up to 90mm) and holes rarely exceed 200m in length. Any angle of hole, from horizontal through to vertical can be drilled
CORE AND HOLE SIZES • Hole dia. Core dia. Reamer (max OD) • EXT 37,7 23,0 37,9 • AXT 48,0 32,5 48,1 Nominal • BX 60,0 42,0 60,1 size (mm) • NX 75,8 54,7 75,8 • NXC 92,1 68,5 92,3 • TBW 60,0 45,2 60,1 • AQ 48,0 27,0 48,1 • BQ 60,0 36,5 60,1 • NQ 75,8 47,6 75,8
Core logging • The log of a diamond drill hole must provide an accurate and comprehensive record of all geological and mineralogical conditions encountered together with any other details concerned with the drilling of the hole. When the hole is sampled, and for core that is not retained, the log sheet represents the only permanent record of what was encountered down the hole.Logsheets must be filed in hard covered log books or files, by property name, area, and level. All log books must be kept in a lockable strong room or a secured place. • BASIC INFORMATION • Written in ink or pencil on the standard caldonian log sheet, • Locality Surface holes : area or claim. • Underground holes : mine or section together with details of the drive or cross cut. For a drill profile, a peg number and distance could be given. Underground holes : hole number/ year (specific to that level)/angle of hole • ii. Every hole at a location must have a different number. • iii. The hole number must be written on every log sheet. • Length End of hole length, ie final depth, in metres, from the collar.
Date Dateof logging. • Direction This applies to angled holes. For surface holes the direction is obtained from a down-the-hole survey, or alternatively survey department can assist when picking up the collar position. Underground hole direction is obtained by offsetting at the collar position. • Angle This can be + or -. For surface holes, the angle is obtained from a down-the-hole survey; if this is not available, a clinometer is used whilst the hole is drilling. Underground holes should be measured, with rods placed in the hole, using a clinometer. • Elevation The Z co-ordinate. This should be recorded as + or -, and show the collar elevation, in metres, to two decimal places, relative to mean sea level. • Co-ordinates The X and Y values, together with their signs should be recorded, in metres, to two decimal places. • DEPTHFrom and To The start and end depth in the hole, in metres, for every rock unit or horizon. Care must be taken to ensure the correct depth is shown by checking recorded lengths written on the core against the core recovery sheets. Any core loss must be recorded. • Note: errors in depth can result in incorrect positioning of the reef or orebody or a major structure. For planning purposes, layouts could be issued based on the wrong position or elevation of the feature unless the correct information has been used.
GEOLOGICAL DESCRIPTION • Rock typeUse the name as recognised at the location concerned. By using accepted terminology. It is easier to plot the hole using standard symbols and colours. • Description This must be a full description of the rock and should not repeat the rock type name which might not be petrologically correct for the rock concerned. • The following items should always be described: • Colour - of the enclosing material or host. • Grain size - of major or minor minerals or mineral phase and interstitial material. Comments on distinct colouration or characteristics of specific mineral phases should be included. • Structure, ie fabric - arrangement of mineral components e.g. granular, foliated, banded. • i.etexture - relationship of one mineral phase to another, or characteristic shape or form of one particular mineral e.g. granoblastic, porphyroblasts with fine inclusions, sulphides with net or cumulus • Occurrence. Weathering state - if rock is fresh, weathered, high oxidised, • decomposed etc. • Disseminated sulphides zone • This represents deformed ore within a shear zone. • Host rock - fine grained, foliated , greenish-grey bio + chl, moderately silicified. • Ore - thin sulphide bands and disseminated sulphide orientated parallel to host rock banding or foliation. Contacts are gradational mainly to the H/wall and sharp to the foot wall and the appearance is of a ductile texture.
SHEAR ZONES • These strike NNW at approximately 330, and dip 65 WSW. • They are characterised by Black markers (chert argillite), brecciated zones with calcite infill, calcite filled joints, and feldspar-quarts porphry. They are leucocratic to mesocraticand often dark melanocrtic when BM rich as well as sporadic quartz veins. • Reef is often wide, continuous and may also contain waste patches which may be difficult to segregate when mining to produce. • Natural these zones are defined by presence biotite, moderate silicification, sulphides (Po and As), and chlorite ~ secondary mineral assemblages.
Strength- measured by difficulty to break the rock. • Discontinuities- noticeable joints or fractures with comments on their surfaces together with amount and type of any alteration or infill material. It is usual to have any rock unit longer than 10cm described as a separate rock type. Horizons of less than 10cm in thickness are included in the description of the enclosing rock, but should be noted. • Details of fracturing, jointing, type of joints and condition of joints can be noted. The amount of information included will depend on whether a separate structural (geotechnical) log is to be completed or not. Major zones of weakness or heavy jointing should always be noted together with any evidence, e.g. iron staining, of water inflow. • Mineralisation details for reef or orebody are required. The type and amount of every mineral present should be noted together with comments on occurrence, texture, size, shape and colour for each mineral. Occurrence includes massive (M), disseminated (D), blebby (B), free (F), banded (Ba), vein (V), smeared/staining (S) or aggregate (Agg). Symbols for commonly occurring minerals are Po (pyrrhotite), Pe (pentlandite), Cp (chalcopyrite), Py (pyrite), Sp (sphalerite), Ga (galena), Au (gold). To record mineral percentages use - (1%), = (2%), + - (3%), + (5%) etc. • SAMPLE INFORMATION • Sample number Use the number and prefix letters as given on the sample ticket. This detail is required for reference to sample submission sheet sent to and received from the assay laboratory. • Sample length The start and end length of the sample should be recorded. The full number must be used, as any shortcuts could lead to confusion later or when plotting.
DATA VERIFICATION • Reef: The geologist who calculates the value and thickness of any reef calculations or orebody intersection should sign the data verification table. The sample thickness will be shown as cm between the sample length amounts for each sample interval. The values for each intersection are written along the edges of that intersection to the right. • The assay value is quoted as a weighted average, i.e. (length x value) / length. • To assist calculation, use the Excel template. The weighted average is shown on the log sheet. Calculation sheets should be saved and filed with the log sheet. • Should any changes be made to data on the log sheet, then these must also be shown on all plans and sections on which the hole has been plotted. This should be done as soon as possible after the change is made.
Ore Reserves • INTRODUCTION • There is no absolute and wholly accurate method of calculating ore reserves. The best that can be done is to make an estimate that is as close as possible to the grade and tonnage of ore that will subsequently be mined out. • The method used should ideally be the best method technically to estimate the tonnage and grade of in-situ reserves and resources. It should be applicable to all mines extracting the same mineral under similar circumstances. It should be understood by all those who need to use the results and not be too complicated to apply. Also, the method should be amenable to computerisation. • Inherent in the calculation is the fact that the sample values used are representative. Thus, it is important for those who take, handle and assay the samples that sources of error are minimised. • Geological interpretation should ensure that effects due to a change in rock type or host to the mineralisation, and controls due to structure are considered before the sample data is treated numerically.
PRIMARY/PROVED ORE RESERVES • Blocks where all sampling has been completed, thereby allowing the limits of payability to be determined. This sampling can be situated in development and/or stoping and can come from the minimum of one dip exposure. All blocks are immediately available for mining. • PROBABLE ORE RESERVES • Blocks where sampling is not complete, that is, where the limits of payability have not yet been determined. • These blocks require small amounts of development to be done in order to determine the limits of payability and to become available for mining. • RECLAMATION ORE RESERVES • Blocks may be evaluated as per Primary and Probable. • These blocks are required to be left in situ to protect shafts, cross cuts etc, and will only become available in the long term. • NOTE: • Evaluation of all the above categories uses a pay stretch method where a manual calculation is used, or a 2D or 3D method if a geostatistical calculation is carried out. • INDICATED RESERVES • Blocks where little or no development has taken place but where geology diamond drilling (from surface or underground) is sufficient to define a distinct and continuous reef in three dimensions. • Evaluation is based on a polygonal (statistical) method or geostatistical method (IPD or OK, backed up with IK). • The same cut off grade and minimum mining width as is used for Primary, Probable, and Reclamation ore reserves should be used. • INFERRED RESERVES • Blocks where little or no development has taken place, but where geology diamond drilling is sufficient to define a distinct reef or mineralised horizon in three dimensions. • Evaluation is based on a polygonal (statistical) method or 2D (or 3D) geostatistical method. • The same cut off grade and minimum mining width as is used for ore reserves should be used. If any other figures are used or factors applied, these must be clearly stated. Best method to be used is polygonal method.
GEOMETRIC METHODS OF ORE RESRVE ESTIMATION • i. Cross Section Method • For each cross section, the rectangular (Polygon) area of influence of each intersection is the thickness x dip distance half way to an adjacent intersection. • The following calculations are required : • Area of rectangle (polygon) - measure or planimeter • Average grade = Area * value or cmg/Total area • Average thickness = Total area/ Total dip distance • The strike distance is half the distance to both adjacent sections, thus : • Volume = Cross section area x strike distance • Tonnages = Volume x SG • MATHEMATICAL METHODS OF ESTIMATION • These are usually applied when a large number of samples are involved. • i. Weighted Averages • The grade and thickness of an area is calculated as : • Average grade or (thickness) = (grade x thickness)/ grade (or thickness) • = sum of all values • Volume = Plan area x average thickness. • Tonnage = Volume x SG • Note : - Plan area assumes the plan is drawn parallel to the strike of mineralisation. • For dipping bodies (reef etc), Volume = Plan area x Sec dip° x average thickness. For steeply dipping reefs, a vertical section is used, Volume = Section area x Cosec dip° x average thickness.
GEOSTATISTICAL METHODS • These methods apply the theory of regionalised variables to the study of mineralised volumes of rock. Since sample values are a result of geological processes they are considered as regionalised variables whose values are a function of their position within the deposit. In ore reserve estimation, the orebody is the region, and grade, thickness, etc are the regionalised variables. The behaviour of ore grades within a given deposit conditions this method to that deposit. The continuity or otherwise of the mineralisation, its variation in grade over the deposit, and the positions of the available samples combine to create a unique situation for each deposit. Full details of the theory involved is given in “Geostatistics”. • All geostatistical methods involve kriging, of which there are several types. Before any one of these can be used, a variogram must be generated for the sample data. A suitable model is then fitted to the sample variogram. Estimation can only proceed when a suitable variogram is availble for the kriging process. Since a large number of varibles and options need to be considered when using these methods, it is usual to carry out this work on a computer using suitable software. • It is important that all databases containing sample data, copies of plots and print outs, together with any data files generated during the evaluation are retained for record and inspection purposes. SAMPLE VARIABILITY • The method used to describe how samples are related to each other spatially requires the generation of a sample semi-variogram. This establishes how sample values vary with respect to their distance apart. • For two values Z (x) and Z (x + h) taken at positions (x) and • (x + h), the difference is (Z(x) - Z (x+h))². This gives a semi-variogram equation : • G (h) = ((Fx) - F(x+h)) ((Fx) - F(x+h))/ 2n • The semi-variogram is generated by plotting the semi-variance against its associated distance of sample separation. The resulting graph shows variability between sample values increases with increases in distance. Beyond the point where the semi-variogram reaches a plateau, the variability between the values equals the sample variance.
DEFINITIONS FOR USE WITH THE CALCULATION OF ORE RESERVES AND MINERAL RESOURCES • CRITERIAEXPLANATION • Re-estimation The calculation of a grade and tonnage for each block or reef based on currently available data, subject to the exclusion of material < cut-off for pay stretch methods. • At year end, a full recalculation is required, ie no carry forward of values or tonnages is permitted, and no blocks to be used less the current year’s depletions. • For blocks using stope face samples, these must be up to date, ie a recently advanced face should be resampled during the month of July. • For calculations using ore body data bases these should be checked and re-run using up to date and re-interpreted intersections. • Sample stationAn underground location defined by a distance from a survey number peg or stope peg. At each station the full extent of the rock exposure should be examined for the presence of reef. All mineralisation should be sampled with a maximum sample length of 60cm. At least two sludge holes sample should be taken on either side of the ore body drilling evaluation drilling should be 7.5 m interval. The dip of any ore body present should be recorded at each set up. • Pay stretch A combination of pay samples obtained from (Pay shoot) development and/or stope face sampling which when combined will give a block of sufficient size so as to generate a stope. Two pay stretches separated by a low grade stretch/area may be combined provided that the smallest (ie the shortest in length) of the two is capable of ‘carrying’ the low grade area. • Note: the larger pay stretch must not be down graded to bring in a marginal area. • Cut-off grade The value determined as the lowest economic value at which a mine can operate according to accepted plan parameters, and break even financially. This value is calculated annually after the final budget for the forthcoming year has been approved, and will be communicated, by management, to operations personnel.
Cut value-The value to which any high grade sample is reduced, so that final calculations are not unduly biased due to the presence of anomalously high values. These values are as follows: ARM block – 8.2g/t • ARS - 11.9g/t • All high grade samples should be cut to the values stated regardless of calculation or estimation method used. • Sampling method -underground samples represent chips of material taken from a panel centred on the sample station position. The width of the panel should not exceed 60cm. • Sample width -The width of a sample in cm, measured perpendicular to the strike of the rock unit or fabric. Reef width is measured between the hangingwall and footwall contacts, normal to the plane of the reef; it is the shortest distance between the waste rock on either side of it. The first and last sample would include 120cm of waste material. • Channel width - Where a reef splits and contains waste material, the total reef width is the sum of all intersected reef widths plus the included waste. • Weighted average -The grade at a sample station or of a drillhole intersection where a number of individual samples have been taken. The weighted average is a ‘mean’ value where each grade value is multiplied by its associated width, and then divided by the total width. • Mathematically, the weighted grade is: (grade x width)/ (width) • True thickness - (i) for reef sampled in development or stoping, the sampled width is the width of all reef samples at a sample station multiplied by a factor based on the reef dip:
- hangingwall sampling (steep dip reef) (width) x sin dip • (ii) for geology boreholes, the intersected reef width is converted to a true thickness, as follows: • - borehole dips in the same or opposite direction to the reef, but is at right angles to the strike of the reef. • true width, x = y sin B • where y = intersected reef width b = dip of drill hole (from horizontal) • D = dip of reef • B = core bedding angle = b - D • Note: for zero degree holes, the negative sign should be disregarded. • - borehole dips in a direction that is not perpendicular to the strike of the reef. • true width, x = y sin B sec d cos D where d = apparent dip of reef in direction of drillhole • B = (b-d) for b>d • = (d-b) for d>b • D = true dip of reef • Note: applies to all reef dips.
Block volume - For a block delineated on plan, the volume is calculated as: plan area x average thickness x secant dip • For a block delineated on a vertical section, the volume is: sectional area x average thickness x cosec dip° • Specific gravity -The SG of reef is 2,86 at Blanket mine. Occasional checks on the different reef types would be recommended. • Note: it is recommended that standard figures are not used. Representative reef samples should be tested and accurate values obtained. • PolygonAn irregular figure whose area of influence is defined by lines perpendicular to and half way between adjacent intersections. Each polygon is based on a single drillhole intersection. The true thickness and grade, recalculated for a minimum mining width, if required, is applied to the whole polygon. Polygons should be adjusted at reef margins so as to follow geological boundaries. • Area of polygon The area of a polygon may be planimetered, or is calculated as the sum of the triangles forming the polygon. • Area = s (s-a) (s-b) (s-c) where a, b, c are the lengths of the sides of a triangle and s = (a+b+c)/ 2 • Volume of polygon Volume = area of polygon x true thickness or SW-CM x sec dip • Tonnage of polygonTonnage = volume of polygon x SG
Underground mapping • This is carried out in order to record details of the reef/seam/orebody together with occurrences of such features as dykes, faults, shears etc. Every development end requires mapping, and this should be done as soon after mining as possible. • EQUIPMENT • 3m and 50m tapes. • Brunton compass or clinorule. • Field book and pencil, or paper copy of mapping template. • Spray paint or chalk. • MAPPING A REEF DRIVE • The up-dip sidewall is mapped. A 50m tape is laid out with zero under the start peg. The tape then continues to the next peg (end peg) in the drive or the face of the drive or raise if there is no peg. At every two metres along the drive an offset perpendicular to the tape is made and the geology recorded for the sidewall at that position. If the reef is complex, intermediate positions can also be mapped. • Plan:At each 2m position or mapping point the offset distance to the sidewall at 1.5m above the drive floor is recorded in a field book or on a copy of the mapping template. • Measurements for the reef at each position are then recorded. The footwall (FW) and hangingwall (HW) position of the reef (or reefs) in narrow ore body are recorded as a distances from the footwall of the drive vertically up the sidewall. If the reef splits, separate measurements are required for each part, (a) and (b) on the sketch below. The dip of the reef at the mapping position is also recorded.
MAPPING OF FAULTS • Care is required to ensure that the fault plane is measured and not the trace of the fault as it intersects the development. • Features that cross a drive or raise can be mapped by offsetting. The dip and dip direction together with comments on the feature's surface, any associated alteration or infill and any displacement are required. • For features that run parallel to the drive, use is made of a Brunton compass which will give the strike (and dip) reading as a numerical value which can then be plotted with reference to magnetic north. • Faults that host the reef or are in the same direction as the reef plane should also be mapped. These features are significant if their dip is different to that of the reef as they can be responsible for cutting out the reef. • MAPPING OF JOINTS • These can be mapped, by offsetting in drives, raises and large excavations. • If there are a large number of joints or fractures it would be normal practice to map them as joint sets, see "Structural Mapping“.