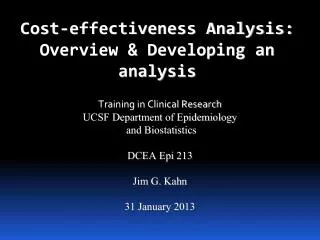
Cost-effectiveness Analysis: Overview & Developing an analysis
Cost-effectiveness Analysis: Overview & Developing an analysis. Training in Clinical Research UCSF Department of Epidemiology and Biostatistics DCEA Epi 213 Jim G. Kahn 31 January 2013. Outline. Overview Components of cost-effectiveness analysis Steps in cost-effectiveness analysis

Cost-effectiveness Analysis: Overview & Developing an analysis
E N D
Presentation Transcript
Cost-effectiveness Analysis: Overview & Developing an analysis Training in Clinical ResearchUCSF Department of Epidemiology and Biostatistics DCEA Epi 213 Jim G. Kahn 31 January 2013
Outline Overview Components of cost-effectiveness analysis Steps in cost-effectiveness analysis Implications of CEA
Why do cost-effectiveness analysis? • Resource allocation is a reality: among social goods, within health care • $ for one intervention decreases $ for another – via budgets • We don’t like to spend huge $ on health care that hardly works • Use health care $ to do most good: CEA is a measure of efficiency efficient allocation saves lives, improves health
How can CEAs make a positive difference? • Huge concerns with rising health care costs in U.S. 18% of GDP, > $2 trillion, 49+ million uninsured
How can CEAs make a positive difference? • Huge concerns with rising health care costs in U.S. 18% of GDP, > $2 trillion, 49+ million uninsured • Renewed attention to international health, e.g., AIDS
How can CEAs make a positive difference? • Huge concerns with rising health care costs in U.S. 18% of GDP, > $2 trillion, 49+ million uninsured • Renewed attention to international health, esp. AIDS • Funding decisions: which programs should get funded? • Cost-effectiveness = one consideration
The Basic Question What health benefits do we getfor money we spend on health care?
Goldman et al, Health Affairs 2005, doi: 10.1377/hlthaff.w5.r5
Cost-effectiveness analysis in context Prior lectures on clinical decision analysis & utilities Now add costs
CE Question Formulation What added health benefits are realized for each added dollar spent on health care?
Choices and CEA • Assessing a choice: comparing 2 or more courses of action with different effects and/or costs. • Clinical management: medication vs. surgery, medication A vs. B (e.g., streptokinase vs. t-PA). • Prevention: program vs. no program, or universal vs. targeted to high risk individuals, or vs. treatment • Health service delivery: incentive payments vs none, innovative programs such as home care vs none.
CEA Framework Costs CE ratio relevant CE ratio irrelevant and not interesting Effectiveness CE ratio irrelevant and interesting
$100k per QALY 0 0.05 0.10 COX-2 Inhibitors vs NSAIDS $12k Comparator: Naproxen $50k per QALY $6k Change in costs $10k per QALY $0 Gain in health benefit (QALYs) Source: Spiegel et al., The Cost-Effectiveness of Cyclooxygenase-2 Selective Inhibitors in the Management of Chronic Arthritis, Ann Intern Med. 2003;138:795-806.
$100k per QALY 0 0.05 0.10 COX-2 Inhibitors vs NSAIDS $12k Comparator: Naproxen Basecase Assumption: Excludes effects on heart $50k per QALY $6k Change in costs Change in cost: $11,600 Change in benefit: 0.04 QALYs Incremental CER: $290,000/QALY $10k per QALY $0 Gain in health benefit (QALYs) Source: Spiegel et al., The Cost-Effectiveness of Cyclooxygenase-2 Selective Inhibitors in the Management of Chronic Arthritis, Ann Intern Med. 2003;138:795-806.
$100k per QALY 0 0.05 0.10 COX-2 Inhibitors vs NSAIDS $12k Comparator: Naproxen Basecase Assumption: High-risk patients $50k per QALY $6k High risk Change in costs Change in cost: $4,720 Change in benefit: 0.08 QALYs Incremental CER: $56,000/QALY $10k per QALY $0 Gain in health benefit (QALYs) Source: Spiegel et al., The Cost-Effectiveness of Cyclooxygenase-2 Selective Inhibitors in the Management of Chronic Arthritis, Ann Intern Med. 2003;138:795-806.
Outline Overview Components of cost-effectiveness analysis Steps in cost-effectiveness analysis Implications of CEA
Two major components of CEA: • Outcome measures – health, cost • Input data
1. Outcomes Cost-effectiveness analysis in health care assesses the incremental gain in health statusachievable with incremental increase in health care resources
Gain in Health Status • Measured in "health outcomes” (as in decision analysis) • Mortality • Morbidity: e.g., episodes of illness, infections, duration of disability (e.g., years of sight) • Life years: expected duration of life • Quality-adjusted life years (QALYs):health life years x utility scores • Disability-adjusted life years (DALYs):burden life years lost + life years * disability weight
Increase in health care resources • Difference in resources between less and more expensive course of action. • Unit = dollars (or any currency), to allow resources of all types to be summed and compared
The Incremental CE Ratio (ICER): • increment in costs between two courses of action • divided by • the increment in health outcomes E.g., cost of universal HIV prevention minus cost of targeted HIV prevention, divided byHIV infections with no prevention minus infections with prevention. Thus, dollars per HIV infection prevented.
Other CE outcomes • Cost-utility analysis (CUA): dollars per QALY gained. Often used interchangeably with “CEA”. • Cost per DALY averted – adopted in global health. Approx. the negative version of cost per QALY gained. • Cost-benefit analysis (CBA): Health outcomes translated into financial values (e.g., willingness to pay). Difference (rather than ratio) used: dollars spent on the intervention minus dollars saved in benefits.
2. Input data • Broad set of input data on health outcomes and costs. • Data collected using various techniques. • How does it all fit together?
Outline Overview Components of cost-effectiveness analysis Steps in cost-effectiveness analysis Implications of CEA
Steps in a cost-effectiveness analysis: overview (1) Define analysis. DA: Clinical or policy situation, alternative strategies. CEA: Economic perspective, CE outcomes. (2) Specify technical approach. Structure (eg tree) and formulas (3) Determine input values. DA: health values (chance nodes, utilities) CEA: costs for programs and medical care. (4) Conduct analyses. (5) Dissemination.
CEA is iterative • Steps usually in order, more or less. • Often desirable to refine or redefine the analysis as it progresses • Good news: Until published, can revise. Feedback and reflection makes better analysis. • Bad news: Until published, can revise. When will this end? • Perfection vs. good enough: experience balance
(1) Define the analysis • Aneurysm: clinical situation = woman, aged 50, with unruptured cerebral aneurysm found incidentally. Options = no treatment or surgery (clipping). • Perspective = societal. i.e., economic effects on patients, providers, insurers, etc not separated. Costs counted regardless of who pays. • Outcome measure is cost per QALY gained. • “This CEA compares surgical clipping to no treatment for the management of an asymptomatic small cerebral aneurysm, for a 50 year old woman, estimating the societalcost per QALY gained.”
Our analysis compares the cost-effectiveness of a step-up approach with a step-down approach in a population of patients with new onset dyspepsia from a societal perspective.
(2) Specify technical approach • Spreadsheet / decision tree analysis • Markov model • Simulation • Dynamic models
The cost per QALY gained is defined as: • Cost with surgery - cost with no surgery • QALYs with surgery - QALYs with no surgery I.e., Δ Cost Δ QALYs Formulation must be incremental: from no intervention to intervention, or from lower cost to higher cost intervention.
(3) Determine input values Here are key cost inputs: Cost input Value (range) Source Clipping $25,150 (18,000-35,000) Cohort study – cost accounting system Moderate/severe disability $20,000/yr (13,000-30,000) Published estimate SAH hospitalization $47,000 ($33,000-$67,000) Cohort study – cost accounting system Discount rate 3% (0-5) CEA guidelines
(3) Determine input values (cont’d) Both effectiveness and cost must be discounted e.g., $47,000 for SAH hospitalization, average 17 years into the future, NPV = $35,912.
(4) Conduct analyses • How are calculations done? • By hand - Instructive once, inefficient and error-prone. • Spreadsheets- Flexible –any structure, input, calculation, outcome, or format E.g., infectious disease epidemic modeling, or interacting Markov models.Must program some standard CEA tasks.For Monte Carlo and other sensitivity analyses, Crystal Ball. • Decision analysis packages - TreeAge, etcDesigned to do CEA tasks, eg trees, inputs, outputs, simple Markov, SA. Learning curve?
Base case graphically, referent case at origin $ $39,666 $534 QALYs 19.74 21.37
Base case graphically,zero cost/QALYs at origin $39,666 $ $534 QALYs 0 19.74 21.37
In manuscript, the results might be presented as follows. • QALYs Costs • Scenario Total Incremental Total Incremental $ / QALY No symptoms, <10 mm, no past SAH • No treatment 21.37 -- $534 -- -- • Clipping 19.74 -1.63 $39,666 $39,132 Dominated
0 5 10 ICERs and Dominance $10k ICERs: Strategy C Comparator vs A: Dominated (strictly) Strategy D B vs A: ($2,800-$1,000) / (5-2)=$600/QALY $5k Costs C vs B: ($9,000-$2,800) / (7-5)=$3,100/QALY Strategy B D vs B: ($6,200-$2,800) / (5.5-5)=$4,800/QALYExtended dominance, if a mix of B & C is possible Comparator Strategy A $0 Gain in health benefit (QALYs)
Incremental analysis: Targeting HIV Prevention, group of 1000 individuals QALYs Program Costs Scenario Total Added Total Added $ / QALY No prevention 20,000 -- $0 -- -- Targeted (100) 20,025 25 $20,000 $20,000 $800 Universal 20,027 2 $200,000 $180,000 $90,000
Sensitivity analysis: How high does rupture risk need to be to recommend clipping?