Download

1 / 38
390 likes | 523 Views
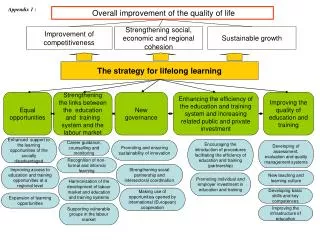
Source: Michael E. Porter. Measures of Competitiveness. Prosperity. Productivity. Competitiveness. Innovative Capacity. Decomposing Prosperity. Prosperity. Domestic Purchasing Power. Consumption taxes Local market competition Efficiency of local industries. Income.

E N D
Source: Michael E. Porter Measures of Competitiveness Prosperity Productivity Competitiveness Innovative Capacity
Decomposing Prosperity Prosperity Domestic PurchasingPower • Consumption taxes • Local market competition • Efficiency of local industries Income Labor Productivity Labor Utilization • Skills • Capital stock • TFP • Working hours • Unemployment • Participation rate • Population age profile
Source: Michael E. Porter Influences on CompetitivenessMultiple Geographic Levels World Economy Broad Economic Areas Groups of Neighboring Nations Nations States, Provinces Cities, Metropolitan Areas
Nordic Countries Northwest Russia • Denmark, Finland, Norway, Sweden • 24 Mio. People (41% of the region) • GDP of € 793bn (74%) • Northwestern Region • 16 Mio. People (27%) • GDP of € 46bn (4%) Baltic States • Estonia, Latvia, Lithuania • 7.4 Mio. People (12%) • GDP of € 34bn (3%) Northern Germany • Hamburg, Mecklenburg-Vorpommern, Schleswig-Holstein • 6.3 Mio. People (11%) • GDP of € 172bn (16%) Northern Poland • Zachodnio-Pomorskie, Pomorskie, Warmins-ko-Mazurskie • 5.4 Mio. People (9%) • GDP of € 24bn (2.5%) Profile of the Region Western shore Eastern shore Source: EU (2004)
Cluster CompositionBaltic Sea Region Export Performance by Cluster World Market Share, 2000 BSR overall: +2.1% (versus +5.3% world trade) Forest Products Telecommunication Petroleum/Chemicals Household Health Care Multiple Business Materials & Metals BSR overall: 5.36% Food & Beverages Power Transportation Entertainment Textiles & Apparel Office Semiconductors Personal Absolute Growth* of Exports, 1995 - 2000 *Growth figures exclude Baltic States and Northwest Russia Source: WTO (2004), Institute for Strategy and Competitiveness, author’s analysis.
Regional CooperationLevels Countries act as one • Stage 3: Joint action • Limited independence • Includes joint positioning of the region abroad, including in international/ supranational bodies • Stage 2: Coordinated action • Medium level of independence • Includes joint efforts to upgrade border procedures, improve infrastructure, develop clusters, .. • Stage 1: Learning and benchmarking • Leaves national autonomy fully intact • Includes networks covering all areas of policy in an “open model of cooperation” Countries act in isolation
Regional CooperationBenefits and Costs of Regional Heterogeneity Low High Degree of Heterogeneity • Easy to develop a common identity • Easy applicability of others’ experience • Balanced distribution of benefits • Regional cooperation is easier but provides fewer benefits • Huge potential gains from regional benchmarking • Huge potential gains from division of labor • Regional cooperation is harder but provides higher benefits
Key Implications Situation Implications of the Report Stage 3: Joint action • More ambition than reality • Current patterns of heterogeneity suggest high benefits but also difficulties in achieving joint action Stage 2: Coordinated action • Some activities currently under way • High level of regional integration signals room for development of strategic action plan Stage 1:Learning and benchmarking • Many activities currently under way • High remaining heterogeneity in the region signals ample room for further cooperation
The Way Ahead • Ongoing discussions in the Region • Validate the performance and business environment quality assessment • Identify areas for further in-depth analysis • Develop the foundations for an institutional capacity to act • Moving to Action • Launch meetings to define a regional strategy for action • Launch institutional structure to coordinate decision making and implementation • BDF Meeting Hamburg 2004 • Launch of the 1st State of the Region-Report • Set a structure for the regional debate • Provide data to review performance, cluster composition, and business environment quality across the Region • BDF Meeting Stockholm 2005 • 2nd State of the Region-Report • Provide data to discuss the positioning of the Baltic Sea Region • Provide data to set regional action priorities • Provide data on current regional efforts
The Baltic Sea Region Entering a New Era Past Present • Ties in the region far below historical precedents • Enthusiasm about freedom and opportunity in the East • Main goal is political: integrate and secure • West providing help to East; East providing new markets and access to low-wage labor • Many trade and organizational ties across the region • Realism about benefits raises demands on cooperation • Main goal is economic: raise prosperity across the region • West and East operating with same objectives from different points of departure
Towards A New Strategy for the Baltic Sea Region • How strong is the economic performance of the Baltic Sea Region? • What is the profile of the economy in the Region? • What are the strengths and weaknesses of the business environments across the Region? • What are the implications for a sound regional strategy?
Real GDP Development Over TimeBaltic Sea Region Countries, 1993 - 2003 Real GDP, PPP-adjusted, 1993 = 100 Sorted by CAGR,1993 – 2003: Source: Groningen Growth and Development Centre and The Conference Board (2004), EIU (2004), authors’ calculations
Key ObservationsProfile of the Region • Clear dominance of the Nordic countries in the overall Baltic Sea Region economy • Countries on the eastern shore still account for only 10% of the regional economy • In addition, Germany, Poland, and Russia all have their economic centers of gravity outside the Region • Overall growth performance of economies in the Region suggests dominance of nation-specific over regional factors • Among western shore countries, Nordic countries did in general better than Germany but even among them differences emerge • Among the eastern shore countries, Poland and the Baltic countries followed different paths. Lithuania in particular stands out with its late bounce-back from the transition crisis
ProsperitySelected European Regions and Countries Real GDP per Capita 2003, PPP-adjusted, $-US (1999) Norway Denmark Germany (North) Sweden British Isles Finland Iberian Peninsula Baltic Sea Region Central Europe Lithuania Estonia Poland (North) Latvia Russia (Northwest) Growth of Real GDP per Capita (PPP-adjusted), CAGR, 2000-2003 Source: Groningen Growth and Development Centre and The Conference Board (2004), authors’ calculations
Key FindingsPerformance Drivers Advantages • Labor utilization - employees per capita and hours worked per employee are highest of all peer regions • Gap to Iberian Peninsula and British Isles is, however, falling; it is slightly increasing versus Central Europe • Labor productivity is on par with Central Europe and Iberian Peninsula, lagging the British Isles • Baltic Sea Region is currently improving its position versus peer regions • Domestic purchasing power of income is lowest of all peer regions • Gap to Iberian Peninsula and British Isles is, however, falling; it is slightly increasing versus Central Europe Disadvantages
Economic PerformanceDecomposition by Baltic Sea Sub-region Note: +++ for >150% above Baltic Sea Region average, ++ for > 50%, + for > average, - for < average, - - for < 30%, - - - for < 50%Source: Groningen Growth and Development Centre and The Conference Board (2004), national statistics (2004), authors’ calculations
Innovation PerformancePatenting in the U.S. U.S.Patents filed per Capita, 2003 Sweden Finland Germany (North) Denmark British Isles Baltic Sea Region Norway Central Europe Iberian Peninsula Russia (Northwest) Poland (North) Lithuania Estonia Growth of U.S. Patents Filed per Capita, CAGR, 1998 - 2003 Note: Bubble size is relative to total U.S. patents filed in 2002; sub-national region shares by GDP share Source: USPTO (2004), author’s analysis.
Innovation PerformanceTop Patenting Organizations Company Country U.S. Patents, 1997-2001 Source: USPTO (2004), author’s analysis.
Other Economic Indicators World Export Market Share over Time World Export Market Share British Isles Baltic Sea Region Central Europe Iberian Peninsula Source: WTO (2004), author’s analysis.
Other Economic Indicators Relative Export Intensity Share of World Exports versus Share of World GDP, 2001 Source: WTO (2004), EIU (2004), author’s analysis.
Central Europe Other Economic Indicators Inward FDI Position Inward FDI stock as % of GDP, Average 1999-2001 Estonia British Isles Denmark Sweden Latvia Baltic Sea Region Iberian Peninsula Lithuania Norway Germany (North) Finland Poland (North) Russia (Northwest) Inward FDI Flows as % of Domestic Capital Formation, Average 1999-2001 Note: Bubble size is relative to FDI stock in 2001; subnational regions by their share of national GDP Source: UNCTAD (2004), author’s analysis.
Other Economic Indicators Multinational Companies’ Home Base Business Week 1000 Fortune Global 500 • British Isles 77 • Baltic Sea Region 30 • Sweden 15 • Finland 5 • Norway 5 • Denmark 4 • Northern Germany 1 • Iberian Peninsula 13 • Central Europe 11 • British Isles 36 • Baltic Sea Region 15 • Sweden 6 • Finland 4 • Denmark 2 • Norway 2 • Northern Germany 1 • Iberian Peninsula 7 • Central Europe 7 Note: Business Week ranks by Market Value, Fortune by Revenues Source: Business Week (2004), Fortune (2004), author’s analysis.
The Composition of Economies • Cluster • Compete across regions/countries • Can locate anywhere • Strong role of manufacturing • Critical for income • Local industries • Do not compete across regions • Tied to location • Dominated by services • More critical for prosperity than for income 31% of employment 42% of income 68% of employment 57% of income • Natural-resource based industries • 1% of income and __employment Source: Michael E. Porter, Economic Performance of Regions, Regional Science (2004), Cluster Mapping Project, Institute for Strategy and Competitiveness, Harvard Business School
Relative Cluster SpecializationBaltic Sea Sub-Regions Nordic Germany Russia Baltic Poland Telecom Forest Products Health Care Oil/Chemicals Food Products Defense Power Household Metals Multiple Bus. Entertainment Office Semiconductor Transportation Textiles Personal Semiconductor Transportation Office Personal Multiple Bus. Textiles Entertainment Power Health Care Household Metals Food Products Oil/Chemicals Forest Products Telecom Defense Defense Oil/Chemicals Metals Multiple Bus. Forest Products Personal Food Products Power Textiles Transportation Entertainment Semiconductor Household Office Health Care Telecom Textiles Forest Products Household Food Products Entertainment Telecom Metals Personal Power Oil/Chemicals Office Transportation Health Care Semiconductor Multiple Bus. Defense Textiles Entertainment Personal Household Metals Transportation Power Defense Food Products Forest Products Multiple Bus. Office Semiconductor Oil/Chemicals Health Care Telecom Higher share Lower Share Source: WTO (2004), Institute for Strategy and Competitiveness, HBS (2004), author’s analysis.
Source: Michael E. Porter Determinants of Productivity and Productivity Growth Macroeconomic, Political, Legal, and Social Context for Development Microeconomic Foundations of Development Sophistication of Company Operations and Strategy Quality of the Microeconomic Business Environment • A sound macroeconomic, political, legal, and social context creates the potential for competitiveness, but is not sufficient • Competitiveness ultimately depends on improving themicroeconomic capability of the economy and the sophistication of local companies and local competition
Business Competitiveness IndexRanking of European Regions and Countries Baltic Sea Region British Isles Central Europe Iberian Peninsula TOTAL RANK 6 Finland 1 Sweden 3 Denmark 4 Germany 5 Norway 22 Estonia 28 Latvia 29 Lithuania 40 Poland 46 Russian Federation 63 TOTAL RANK 9 United Kingdom 6 Ireland 21 TOTAL RANK 21 Germany 5 Austria 17 Slovenia 30 Czech Republic 35 Hungary 38 Slovak Republic 42 Poland 46 TOTAL RANK 27 Spain 25 Portugal 36 Source: Global Competitiveness Report (2003), author’s analysis.
Business Environments’ in the Baltic Sea Region Key Observations Context for Firm Strategy and Rivalry • Companies competing globally on innovation and differentiation • High formal openness of markets • Low rivalry on many local markets • High level of taxation, especially on labor, reduces incentives • Presence of distortive subsidies, especially in Germany and Russia Factor (Input) Conditions Demand Conditions • Strong physical infrastructure, especially for communication • High skill base of the labor force • Well developed science system • Public servants apply laws with neutrality; low level of corruption • Significant level of bureaucracy • Emerging weaknesses in the education system • Demanding regulatory standards, especially on environmental issues • Buyer sophistication, including government procurement, is only average Related and Supporting Industries • Presence of a number of globally competing cluster • Strong basis for the activation of existing clusters Source: Global Competitiveness Report (2003), author’s analysis.
Factor ConditionsSpending on Human Resources Public expenditure on education as % of GDP, 2001 Denmark Sweden Baltic Sea Region Norway Lithuania Finland Estonia CentralEurope Latvia Poland (North) Germany (North) Iberian Peninsula BritishIsles Growth in Spending on Human Resources, CAGR 1995-2001 Source: EU Structural Indicators (2004), author’s calculation
Factor ConditionsAverage of Reading, Scientific, and Mathematical Literacy Average Educational Attainment, 2000 OECD average Source: OECD PISA-Study (2003), author’s calculation
Context for Strategy and RivalryMarket Pressure Baltic Sea Region Nordic Germany Baltic Poland Russia Effectiveness of Anti-Trust Policy 10 Hidden Trade Barrier Liberalization 11 Foreign Ownership of Companies 12 Intensity of Local Competition 18 Tariff Liberalization 20 Administrative Burden for Start-Ups 22 Extent of Locally Based Competitors 23 Extent of Distortive Subsidies 29 11 10 16 22 24 21 37 17 5 13 11 13 15 34 4 93 43 41 52 39 38 34 46 26 45 52 47 51 45 52 46 78 73 79 93 83 76 84 48 70 • Nordic and Germany both formally open for competition but effective competitive pressure is significantly lower in Nordic countries • High differences in competitive intensity among Baltic countries, Poland, and Russia Source: Global Competitiveness Report (2003), author’s analysis.
Context for Strategy and Rivalry Taxes on Production Direct Taxes and Social Security Contributions as % of GDP, 2002 Social security contributions Direct taxes (labor, capital) Source: Eurostat (2004), author’s analysis.
Context for Strategy and RivalryFlexibility of Firing Less flexible More flexible Source: World Bank (2004), author’s analysis.
Overall Cluster Strength in EuropeGCR Ranking EU-14 + Norway 2 4 5 7 8 9 10 14 15 17 18 21 25 41 51 Finland Italy Germany Denmark Sweden United Kingdom France Austria Netherlands Spain Ireland Belgium Norway Portugal Greece Accession Countries 31 32 33 34 40 44 45 53 68 Czech Republic Lithuania Latvia Poland Slovak Republic Estonia Slovenia Hungary Malta Source: Global Competitiveness Report 2003/04 , Institute for Strategy and Competitiveness (2004)
Innovation Capacity Rank on Innovation Capacity Index, 2003 1 5 10 15 20 25 30 35 40 Source: Michael E. Porter/Scott Stern (2003), author’s calculations
Proportion of Scientists and Engineers Index Innovation Linkages Index Operations and Strategy Index Cluster Innovation Environment Index Innovation Policy Index Innovation Capacity Sub-Index by Country or Sub-Region Rank on Innovation Capacity Sub-indices, 2003 1 10 20 30 40 50 60 70 80 Source: Michael E. Porter/Scott Stern (2003), author’s calculations
Factor ConditionsTotal R&D Spending Gross Domestic R&D Expenditure as % of GDP, 2001 (or latest available) Nordic Baltic Sea Region Central Europe British Isles Germany (North) Baltic States Iberian Peninsula Poland (North) Annual Growth of Gross Domestic R&D Spending, average of three preceding years - 2001 Source: EU Innovation Scoreboard 2003, author’s calculation
Factor ConditionsShare of R&D Spending by Business Business Share of Total R&D Spending, 2001 (or latest available) Source: EU Innovation Scoreboard 2003, author’s calculation