Download
1 / 7
80 likes | 268 Views
Development of a Risk Atlas in India. India has multiple hazards that it must combat namely: Drought 2. Floods 3.Cyclone 4.Earthquake While previous disasters form the basis of developing a threat perception, the important element for assessing risk

E N D
Development of a Risk Atlas in India • India has multiple hazards that it must combat namely: • Drought • 2. Floods • 3.Cyclone • 4.Earthquake • While previous disasters form the basis of developing a • threat perception, the important element for assessing risk • is to develop a dynamic capability. • In all the above disasters except earthquakes, such a • capability can be developed with integration of multiple data • sources.
Development of a real time drought monitoring system • The Geographical Information System forms the basic layer for the development of this capability. • Inlay of data from multiple satellites and development of a mosaic of crop classification is necessary to develop a drought assessment mechanism since different crops have varying responses to severe weather conditions. • Supplementing this with data of rainfall, soil moisture and surface temperature on a spatial platform is essential information to monitor crop health . • We have now identified methodologies for tracking the white grub disease such in sugar cane and will be moving on to other crops. This we hope to integrate with soil moisture, surface temperature and humidity to develop alert systems • The essential difference of this approach and the one currently in practice is that it is aimed at the user community in a format that relates to the ground conditions. So far we have been working with the state governments right up to the district level but shall make this available on a web site with a farmer alert for a 7 day weather forecast. The later will take another 6 months.
Essential for development of an insurance mechanism for combating impact of drought • There should exist some basic estimates of productivity which form a baseline income to be insured. • Currently these estimates are very expensive to obtain and alternatives such as group insurance on a circle basis rather than village as a unit have proved unpopular with farmers. • Insurance companies were therefore forced to try weather linked insurance products. These have also encountered basic limitations because the network of stations for rainfall recording are few which do not account for local variations. • Therefore the integration of GIS platform with satellite data provides not only variability at the sub district level, village level but also a framework for a more robust insurance product.
Gwar area Pink colour (61,538 ha) Bajra area Yellow Colour (76,841 ha) Paddy area Blue colour (50,139 ha) Cotton area Green colour (1,55,925 ha)
Severely Affected Villages Hailstorm Occurred on 12 march 2007 Zainabad The 37 villages severely affected were accurately identified and validated by the district administration. Dispute existed over crop damage in the village Zainabad. Inputs from the Ministry of Science and Technology resolved the issue. No damage from the hailstorm was found to have occurred.
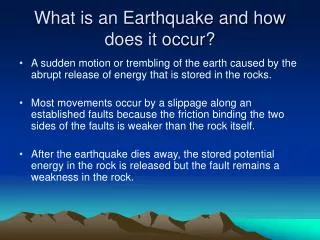
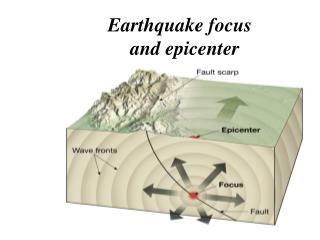
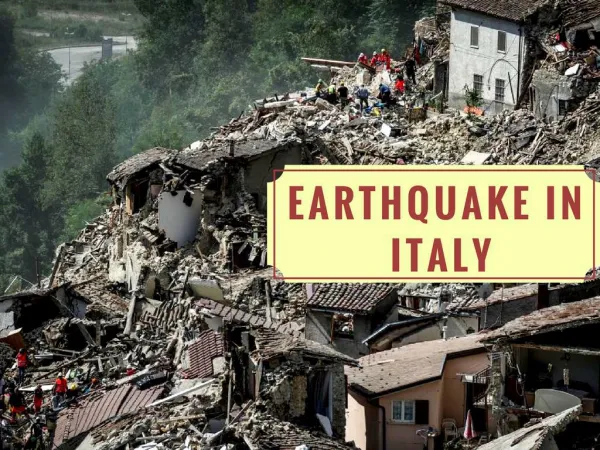
Risk Mapping for Earthquakes • At our current level of scientific knowledge it is not possible to predict earthquakes. • Therefore as a first step the country has been divided into five zones which mark the vulnerability of the areas. Zone 5 is most vulnerable and therefore in decreasing order with zone 1 being fairly safe. • For cities in zone 5 a detailed micro zonation has been commissioned with the first cut on a scale of 1:50000 which will finally be completed on a 1:10000 scale. • This detailed exercise will build a capacity to further draw up building codes accurately based on liquifaction and ground motion studies.
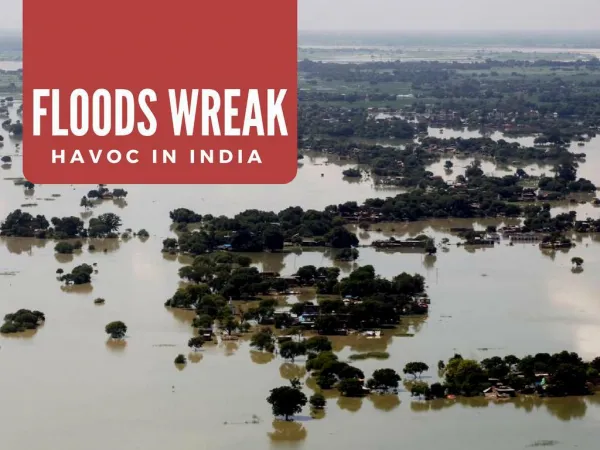
Current Development for Flood Management • The attempt is to integrate hydrology and river flows and weather forecasting. • The Plan is to do the hydrology in Digital Elevation Plane using data from the Survey of India and images from Cartosat 2. • Data of cross-sections, river flows and inundations from previous events form the basic information. • Using these informations we hope to fine tune the model and then link it to weather forecasts. • Forecasting options appear to be to use boundary conditions from global models and then go on do mesoscale modelling and link this into the hydrology model • Similar modelling possibilities appear to exist for cyclone impact forecasting where data of wind speeds, rain and storm surge could be built on a GIS platform. The advantages are in earmarking threats and losses at the local scale.