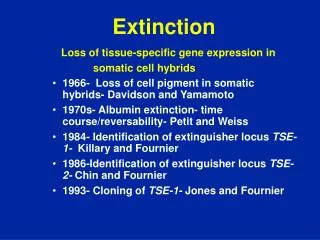
Extinction
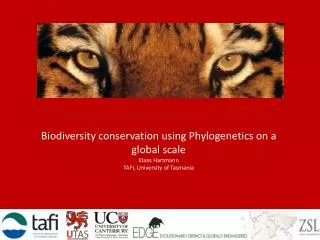
Biodiversity conservation using Phylogenetics on a global scale Klaas Hartmann TAFI, University of Tasmania. Extinction. >100,000 extincts per year 100-1000 times background rate 39% of IUCN Red List species are endangered. Charismatic Megafauna. Biodiversity measures. Species richness

Extinction
E N D
Presentation Transcript
Biodiversity conservation using Phylogenetics on a global scaleKlaas HartmannTAFI, University of Tasmania
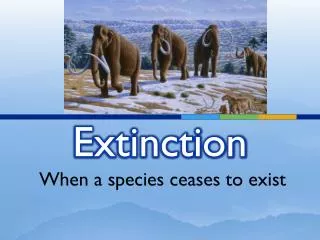
Extinction • >100,000 extincts per year • 100-1000 times background rate • 39% of IUCN Red List species are endangered
Biodiversity measures • Species richness • Species definition unclear • Species distinctiveness not considered • Phylogenetic diversity (PD) • Dan Faith and Ross Crozier
The Noah’s Ark Problem • Species have a survival probability which can be increased at a cost • Objective: maximise future expected PD • Some algorithms to produce optimal solutions have been developed • K. H. and M. Steel. (2006). Maximimizing phylogenetic diversity in biodiversity conservation: greedy solutions to the Noah's Ark problem. Systematic Biology 55(4), 644-651. • K. H. and M. Steel. Phylogenetic diversity: From combinatorics to ecology. Book chapter for: Reconstructing evolution: New mathematical and computational approaches (eds. O. Gascuel and M. Steel) Oxford University Press • T. Gernhard, K. H. and M. Steel. Stochastic properties of generalised Yule models, with biodiversity applications. Journal of Mathematical Biology
Issues • Too complex • Difficult to integrate with existing approaches
Species Specific Indices • An SSI attributes a single value to each species • Some are easy to understand • Examples • Pendant edge • Fair proportion • Equal splits • Shapley value
SSI vs PD • D.W. Redding, K. H., A. Mimoto, D. Bokal, M. Devos and A.O. Mooers. Evolutionarily distinct species capture more phylogenetic diversity than expected. Journal of Theoretical Biology 251, 606-615.
Bird EDGE • 9,787 species The Data: • Half of the species have sequence information • All have taxonomic information • Hundreds of (conflicting) expert trees • How do we combine this information???
Bird EDGE approach • Species are divided into patches • All expert trees for a patch are combined • Taxonomic information is used to enforce monophyletic genera where possible • The constrained patch trees are run with a modified version of mrBayes 3.1.2
Blue Fern • Two rack IBM Blue Gene/L • 4096 cores • 1 Terabyte RAM • 11.2 Teraflops • 53kW power consumption • One run takes about 5 cpu years
Bird EDGE approach • A BEAST skeleton tree is used to provide probability distributions of the root age for each patch • EDGE Indices are produced
Acknowledgements Financial contributors: • University of Canterbury (NZ) • Allan Wilson Centre for Molecular Ecology and Evolution (NZ) • Google Inc. (USA) • Simon Fraser University (Vancouver) I am gratefully indebted to: • Arne Mooers • Mike Steel • Walter Jetz • David Redding • Gavin Thomas • Tanja Gernhard • Too many others to list!