Download
1 / 2
20 likes | 157 Views
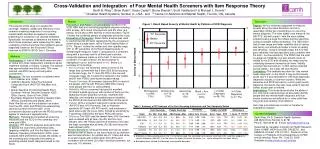
Figure 1. Rasch Based Severity of Mental Health by Patterns of SCID Diagnosis. 2. 2. 75 th Percentile. Median. 1. 1. 25 th Percentile. 0. 0. Severity of Mental Health. -1. -1. Table 1. Summary of IRT Analyses of the Four Screening Instruments and Two Composite Scales. -2. -2.

E N D
Figure 1. Rasch Based Severity of Mental Health by Patterns of SCID Diagnosis 2 2 75th Percentile Median 1 1 25th Percentile 0 0 Severity of Mental Health -1 -1 Table 1. Summary of IRT Analyses of the Four Screening Instruments and Two Composite Scales -2 -2 Reliability Item Coverage People Coverage Validity (to SCID) Efficiency\a AUC R Rel Eff Scale No. Min Avg Max <Min Range >Max Alpha Item Person Sens. Spec. % Items ASI PCS 11 -2.6 -0.5 2.9 9% 89% 2% 0.81 0.99 0.55 95% 28% 77% 12% 0.73 9% GSS IDScr 5 -2.5 -1.8 -0.3 4% 84% 12% 0.78 0.99 0.52 92% 48% 80% 5% 0.80 4% -3 -3 K10 10 -1.0 -0.3 1.0 2% 98% 0% 0.89 0.99 0.86 83% 64% 79% 11% 0.89 10% No Diagnosis (n=166; 31%) Anxiety Only (n=112; 21%) 1-2 Other Diagnoses (n=36; 7%) Mood Only (n=72; 13%) Mood + Anx. (n=141; 26%) 3-4 Other Diagnoses (n=17; 3%) PDSQ\b 67 -2.9 0.3 3.4 2% 98% 0% 0.94 0.99 0.92 86% 43% 74% 72% 0.56 40% All items 93 -2.9 0.0 3.4 0% 100% 0% 0.96 0.99 0.95 89% 54% 83% 100% -- 100% Best 11 items 11 -2.0 0.0 1.7 2% 98% 0% 0.76 0.99 0.75 82% 67% 83% 12% 0.91 11% \a Efficiency is measured based on the % of all items used, the correlation of screener to all items (R), and their product or relative efficiency (Rel Eff). For the latter, the lower the score the better (i.e., same information for fewer items). \b Excluding items related to substance and somatic disorders Cross-Validation and Integration of Four Mental Health Screeners with Item Response Theory Barth B. Riley\1, Brian Rush\2, Saulo Castel\2, Bruna Brands\2, Scott Veldhuizen\2 & Michael L. Dennis\1 \1 Chestnut Health Systems, Normal, IL, USA and \2 Centre for Addiction and Mental Health, Toronto, ON, Canada Introduction Results Discussion Prevalence and Pattern of Comorbidity: Based on the SCID, 69% had a co-occurring psychiatric disorder including 53% anxiety, 42% mood, 6% psychotic and 5% other (e.g. eating). Since about 36% had two or more disorders, Figure 1 shows the combined pattern of diagnoses along the x-axis. Evaluation of Screeners: Rasch factor analysis was used to confirm that the 93 items represented by the 4 screeners varied along a single factor, with a Factor Stability Ratio of 8.7%. Figure 1 shows the median and inter-quartile range (25th to 75th percentile) of the Rasch-based severity of mental health measure. Table 1 compares the 4 screeners, along with a summary row for all items and a shorter composite measure made up of the best 11 items across screeners. For each criterion, the best screener is highlighted in green and the worst in red. Below is a summary of the findings. Reprise: All four screeners appeared to measure severity along the same dimension and do a reasonably similar job of predicting a co-occurring mental diagnosis. The most widely used measure, the ASI PCS, did well overall – with the most notable problems being a large floor effect and low specificity (ruling out people without problems). The GSS IDScr had a lower range and lower reliability (due to having less items), but actually did better in terms of validity and efficiency. Using a narrower range, the K10 had good reliability, the best specificity and correlation with the total – but low sensitivity. The PDSQ had the most coverage and reliability, but was actually lower on validity to the SCID and efficiency for measuring the underlying dimension formed by all items. Validity could be improved with an 11-item version selected across scales – but it was still less efficient. Limitations: This analysis was done for “any mental health diagnosis” on the SCID. It may be that results would vary if it was replicated for individual diagnoses, diagnostic classes, or common clusters. While the measures and SCID focused on current (past month) diagnosis, the results may also have varied if we had looked at past year or lifetime. Implications: This study demonstrates the ability of four commonly used screeners to accurately identify people with any mental health diagnosis and that shorter scales can actually be as or more valid than long ones and certainly more efficient. Item map and references on back of handout or available on request The purpose of this study is to assess the coverage, reliability, validity and efficiency of four common screening measures of co-occurring mental health disorders as applied to people presenting for substance use disorder treatment. Specifically, we wanted to determine the extent to which these screeners were measuring the same underlying construct and how they related to actual diagnoses based on the Structured Clinical Interview for DSM IV (SCID) Axis 1 Disorders. Methods • Participants: A total of 546 adults were recruited at intake from three independent substance abuse treatment facilities in Ontario, Canada. The sample was approximately two-thirds male, 75% never married, and 25% having criminal justice involvement. • Measures: The four screeners considered were: • K10 (Kessler et al., 2002) • Addiction Severity Index Psychological • Composite Score (ASI PCS; McLellan et al., • 1992) • Global Appraisal of Individual Needs Short • Screener--Internal Disorder Screener (GSS • IDScr; Dennis, Chan & Funk, 2006) • Psychiatric Diagnostic Screening Questionnaire • (PDSQ; Zimmerman and Mattia, 2001) • Note: We did not use the substance use scales from the ASI, GSS, and PDSQ, the externalizing disorder screener from the GSS, or the somatoform disorder scale from the PDSQ as they appear to measure a separate factor. • Methods: Participants completed all screening measures and the SCID on the same day and were paid C$50. • Analysis: IRT (Rasch) analyses were performed to assess the instrument unidimensionality, targeting, reliability, and fit to the Rasch model. Receiver Operating Characteristic (ROC) curve analyses were performed to assess the validity of the screening and composite instruments in predicting mental health diagnosis based on the SCID. • Item Coverage: the screeners varied in terms of the range they covered with the 5-item GSS IDScr focusing on the low range, the 11-item ASI PCS in the low and moderate range, the 10-item K10 centered in the middle, and 67-item PDSQ covering the broadest range. • People Coverage: All screeners captured 84% or more of the people, with the ASI PCS and GSS IDScr having more people with floor or ceiling effects. • Reliability: All four screeners had good to excellent Cronbach’s alpha (going up with number of items per the Spearman Brown prophecy formula), excellent item reliability, and moderate to excellent person reliability; the PDSQ did the best and the GSS IDScr did the worst. • Validity: All four screeners had good to great sensitivity (ASI PCS best, K10 the worst), bad to moderate specificity (K10 best, ASI PCS worst), and moderate to good area under the curve (AUC) formed by sensitivity by 1-specificity (GSS IDScr the best, PDSQ the worst). • Efficiency:The GSS used the fewest items (5%) that were well correlated with all items (R=.80) and the most efficient (4%); the PDSQ used the most items (72%) was the least correlated with all items (R=.56) and hence the least efficient (40%). Contact Information Barth Riley, Ph.D. Chestnut Health Systems, 448 Wylie Drive, Normal, IL 61761 Phone: 708-445-8172; E-mail: bbriley@chestnut.org. Supported by Canadian Institutes for Health Research Grant 119685, NIDA Grant R21 DA025731, and SAMHSA Contract 270-07-0191. Poster 81 at the College on Problems of Drug Dependence (CPDD) annual meeting, Reno, NV, June 25, 2009. Available at www.chestnut.org/li/posters Across Screeners: Using all 93 items from across scales worked as well or better on the first criteria but by definition was the least efficient. An optimal set of 11 items did close to as well overall, with a little higher AUC (83%) and correlation with all items (.91) than individual screeners, but was only 11% efficient.
References: Dennis, M., Chan, Y-F., & Funk, R. (2006). Development and validation of the GAIN Short Screener (GSS) for internalizing, externalizing and substance use disorders and crime/violence problems among adolescents and adults. The American Journal on Addictions, 15, 80-91. Kessler, R.C., Andrews, G., Colpe, L.J., Hiripi, E., Mroczek, D.K., Normand, S.-L.T., Walters, E.E., & Zaslavsky, A. (2002). Short screening scales to monitor population prevalences and trends in non-specific psychological distress. Psychological Medicine, 32 (6), 959-976. McLellan, A.T., Kushner, H., Metzger, D., Peters, R., Smith, I, & Grissom, G. (1992). The fifth edition of the addiction severity index. Journal of Substance Abuse Treatment, 9, 199-213. Zimmerman, M., & Mattia, J.I. (2001). The psychiatric diagnostic screening questionnaire: Development, reliability and validity. Comprehensive Psychiatry, 42(3), 175-189.