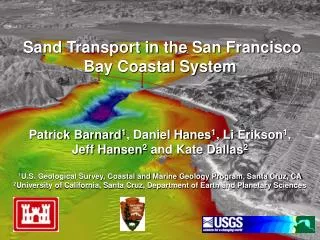
Temporal Evolution and Spatial Dynamics of Cluster Auroral Arcs
180 likes | 286 Views
This study explores the temporal evolution and spatial dynamics of discrete auroral arcs using Cluster satellite observations. The research delves into the characteristics of auroral potentials, electron beams, surge horns, and magnetic field structures. Results indicate the presence of standing waves, energy flow patterns, and ionospheric modifications during various events. The investigation also examines the interplay between monopolar and bipolar electric fields in plasma boundaries, shedding light on their respective roles. The study showcases the evolution of auroral phenomena and associated field-aligned currents, providing insights into magnetosphere-ionosphere interactions.

Temporal Evolution and Spatial Dynamics of Cluster Auroral Arcs
E N D
Presentation Transcript
Recent KTH Cluster research T. Karlsson, A. Collier, T. Johansson, S. Liléo (Figueiredo), G. Marklund, m. fl.
C4 m n L = 4.6 MLT = 02:43 Pi2 pulsations within plasmasphere2003-01-21 Andrew Collier, KTH and Univ. Of KwaZulu-Natal, Durban
Poynting Flux, P C4 P m n L = 4.6 MLT = 02:43 CONCLUSIONS 1. Phase shift 90 between E and B, indicative of standing wave in radial direction – cavity resonance 2. Poynting vector indicates energy flow in azimuthal direction, possibly indicating open-ended cavity.
s/c 1 s/c 2 +16’30’’ s/c 4 + 39’30’’ s/c 3 + 57’ 35' 35' j//up event 1 Cluster results temporal / spatial evolution of discrete auroral arcs Figueiredo et al., AG, 2005 Temporal Evolution Symmetric U-shaped potential j// V= ∫ E^·ds LS Inverted-V arc LS Inv-V arc arc V= ∫ E^ · ds merging together intensifying PSBL CPS PSBL CPS PSBL CPS Cluster s/c 1 obs 030501 Upward 10 keV O+-beam GM050825 1keV e- ↓ V (kV) 0 -10 820 E (mV/m) 0 3 j// (mA/m2) 0 ↓ O+ 1-10 keV ↑ ↓ O+ 10-38 keV ↑O+ 0' 45' 15' 30'
DMSP image surge DMSP Cluster surge horn surge horn poleward expansion 0.5 km/s Cluster s/c Cluster results j//upevent 2 temp / spatial evolution of discrete auroral arcs Cluster observations 030503 V= ∫ E^ · ds j// surge horn multiple arcs merging together & intensifying PC PS PC PS GM050825 South Pole ASI images s/c 1 5 kV 10 mA/m2 s/c 2 — +7’ s/c 4 — +22’ 20' 20'
Evolution of pos & neg U-shaped potentials in two connected FAC branches Marklund et al, 2006 s/c 1 s/c 3 s/c 2 s/c 4 acc ions 14 FEB 2001 EVENT SUMMARY · bipolar, div E-field » 1.7 V/m · PSBL / CPS boundary & Ne-grad · scale size of 8 km · DF^,increases from » 0.4to 2.7 kV in 100 s · DF// in jllup» - DF^ in jlldown · Local Ne-min & E-region Ne-hole · downward FAC » 10 µA/m2 DF//decreases from 3 kVto 1 kV acc electrons conv E-field DF^ = ∫ E^ ·ds increases from 0.4 kVto3 kV s/c 1 s/c 3 s/c 2 s/c 4 » div E-field · · Ne-hole black aurora aurora t = 100 s t = 0 s t = 200s t=300s Auroral current circuit GM050825
Cluster data j//down event 2 evolution of div E-field structures div E^ Bt EN Bt EN div E ^ = 0.3 V/m -Vs/c V -Vs/c V EFW FGM data PSBL CPS PSBL CPS up FAC down FAC up FAC down FAC div E ^= 1.7 V/m Bt EN div E ^ Bt EN -Vs/c V -Vs/c V PSBL CPS up FAC down FAC PSBL CPS up FAC down FAC Marklund et al, 2006 GM050825
5. Evolution of U+-potential: Simulation of Event 1 Jll ENS equator L= 8.25 Cut along Cluster track L= 7.25 s. iono- sphere ENS Jll Cluster track cross-section Streltsov and Marklund, acc for JGR, 2006
Where do monopolar and bipolar E-fields occur with respect to boundaries ? Statistical study of bi- & monopolar E-field events Johansson et al, accepted Ann. Geophys. 2006 Equatorward, monopolar E-fields, are found at the PC boundary in the evening LT sector PC PSBL CPS Interpretation Bipolar E-fields are found at particle boundaries within PS (Marklund et al, 2004) Bipolar Monopolar fields, if plasma, dense enough to support connecting FACs, exists on one side of the boundary only Bipolar fields, if plasma, dense enough to support connecting FACs, exists on both sides of the boundary GM050825
beta bipolar ┴ potential monopolar Eeast Eequator Johansson et al., accepted Ann. Geophysicae, 2006
Auroral potential and associated FAC reconfiguration during thinning of the PSBL Marklund et al, subm to JGR, 2006 t = t0 t = t0 + 16 min
Auroral potential reconfiguration: Cluster observations Cluster s/c 1 t= t0 Cluster s/c 2 t = t0 + 16 min PEACE electron data ^ CPS CPS PSBL PSBL F^ F^ EFW & FGM data Potential step -Vs/c -Vs/c Potential well Es Es BT monopolar E-field BT Bipolar E-field FAC FAC
Auroral scale sizes (ongoing) 5 km 5 km # # S(n) • Which are the characteristic scale sizes of E, FAC, Δn and how are they related to mono/conv/div E, ΔV, Kp, ΣP…. ? • >1000 events S(E) 2 km 4 km # # S(FAC) gyroradius Johansson et al.
Expected correlation with constant ionospheric conductivity and no E// : En Bt High-altitude signatures of ionospheric density depletions T. Karlsson et al. Instead sometimes, correlation [downward j// ] ~ En 2005-05-19, SH, MLT ~ 20 j//(mA/m2) En(mV/m) upward current downward current t (s)
Jn S En Model – ionospheric modification by downward FACs From earlier simulations j// Magnetosphere upward j// downward j// Ionosphere
j// j// SP SP En En DBt DBt 2002-04-27 2005-01-11
Expected correlation with constant ionospheric conductivity and no E// : Instead sometimes, correlation [downward j// ] ~ En 2005-05-19, SH, MLT ~ 20 En j//(mA/m2) En(mV/m) upward current Bt downward current t (s) High-altitude signatures of ionospheric density depletions T. Karlsson et al.