Download
1 / 1
10 likes | 158 Views
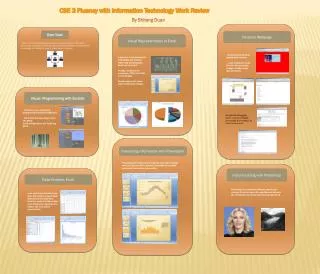
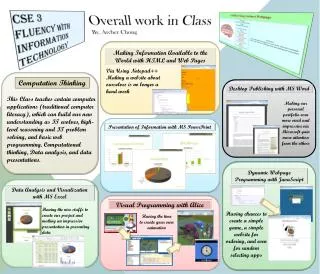
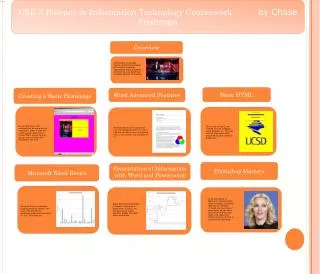
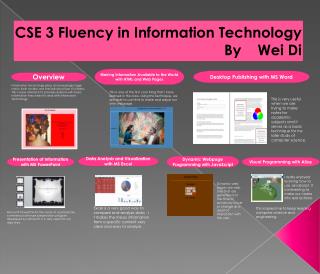
This course, led by Veena Sridhar, emphasizes fluency in information technology through computational thinking and application of essential IT principles. Students learned to manipulate images using Photoshop to enhance or correct visual elements. The curriculum includes data analysis using Excel, enabling students to create visual representations of data for effective presentations. Additionally, Word and PowerPoint were utilized for structured information delivery, while Notepad++ facilitated web page creation, making information accessible online. This holistic approach equips learners with crucial IT skills.

E N D
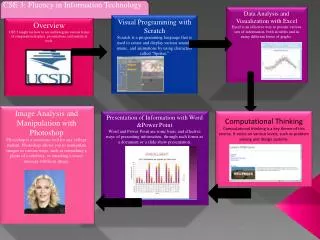
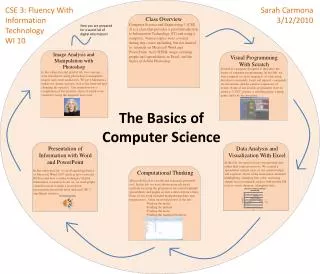
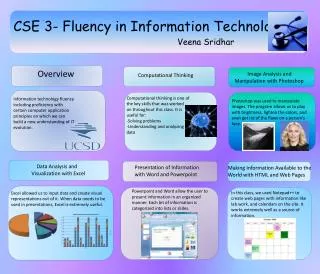
CSE 3- Fluency in Information Technology Veena Sridhar Overview Image Analysis and Manipulation with Photoshop Computational Thinking Computational thinking is one of the key skills that was worked on throughout this class. It is useful for: -Solving problems -Understanding and analyzing data Information technology fluency including proficiency with certain computer application principles on which we can build a new understanding of IT evolution. Photoshop was used to manipulate images. The program allows us to play with brightness, lighten the colors, and even get rid of the flaws on a person’s face. Data Analysis and Visualization with Excel Presentation of Information with Word and Powerpoint Making Information Available to the World with HTML and Web Pages Powerpoint and Word allow the user to present information in an organized manner. Each bit of information is categorized into lists or slides. In this class, we used Notepad++ to create web pages with information like lab work, and calendars on the site. It works extremely well as a source of information. Excel allowed us to input data and create visual representations out of it. When data needs to be used in presentations, Excel is extremely useful.