Download
1 / 7
70 likes | 124 Views
Dive into the complexities of neuroimaging studies, exploring key questions and concepts related to data analysis, comparisons between scans, receptor occupancy, and more. Learn about specific brain regions, experimental techniques, and the nuances of interpreting results accurately.

E N D
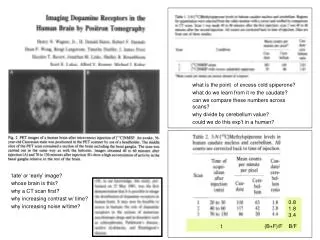
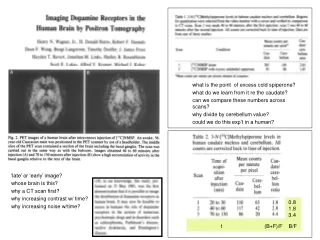
what is the point of excess cold spiperone? what do we learn from it re the caudate? can we compare these numbers across scans? why divide by cerebellum value? could we do this exp’t in a human? ‘late’ or ‘early’ image? whose brain is this? why a CT scan first? why increasing contrast w/ time? why increasing noise w/time? 0.8 1.8 3.4 t (B+F)/F B/F
understand this? got equilibrium? • where do error bars come from? • (if so) is the Y axis correct? • where does “specific putamen” come from – special brain area known only in Sweden? where does “expected spec binding” come from? Is this a safe comparison? what factors are ignored? • what is plotted? (B vs F) – how did they get these values? • how did they get 5 data points • what is the slope near origin? • what is the assymptotic value for Y axis?
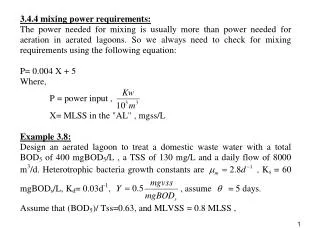
raclo in cereb (assume = free) --> plug into Bmax*Free/[Kd + Free] using Bmax and Kd from Healthy controls --> predicts B at equilib for schizo patients. Compare to actual B measured for patients (via [striat-cereb] per injected dose – I hope) receptor occup = DB/B (fractional change in binding due to presence of bound drug) = (Bpredicted – Bactual)/Bpredicted first ‘drug occupancy’ study with PET? claim: uniformity of occupancy of D2 by different drugs suggests that occupancy level is related to efficacy.
typically written as… P F B what’s all this about? what is F? conservation of mass Mintun: can’t estimate Bmax and rate constants from high spec act expm’t under what condition? what is the blue? what is the fraction of P that is blue – according to Mintun? according to us?
parameter estimation – what is it? why is it iterative? simulations? what are they good for? what are they used for here? sensitivity analysis – huh? kon*Bmax = Bmax koff KD BP is an equilibrium ratio (has not units of time or rates) but we can get it from a TRANSIENT experiment.
anything tricky about using an in vitro sample for anatomy? what’s the difference between expt 1 and expt 2 in same baboon? why didn’t they estimate BP in 2nd study?
terms for next week: Sept 21 displacement release endogenous simulation what is Logan proving by her simulations? where they get their parameter vals what things might be causing DA release in Koepp expt? what might have been a better control condition(s)? what do (+) changes in binding potential (Fig 2) mean? what is the ‘proof’ that DA release is being measured? what is being optimized in Morris paper? where do they get their parameter vals?

:List[T]={...}](https://cdn1.slideserve.com/2234820/slide1-dt.jpg)


![[ t-t-t ]](https://cdn1.slideserve.com/3099327/slide1-dt.jpg)