Download
1 / 54
640 likes | 1.02k Views
Sustainable Development Practice in China. Energy and Industry. Human and Energy, Industrial Revolution and Globalization . Energy Principles Energy forms and types of Energy Sources Energy, Industrial Revolution, Globalization Energy, Air Pollution and Climate Change Energy Crisis

E N D
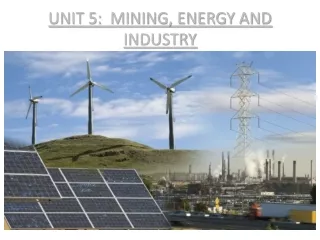
Sustainable Development Practice in China Energy and Industry
Human and Energy, Industrial Revolution and Globalization • Energy Principles • Energy forms and types of Energy Sources • Energy, Industrial Revolution, Globalization • Energy, Air Pollution and Climate Change • Energy Crisis • Alternative Energies
Energy is important … • Energy supports living species on the earth. The development of human society is consuming huge amount of energy. • Plants fix solar energy with water, nutrients, and CO2; animals, so as human being, take food for their energy need; • For living, work, industry and transportation, human consume energy, mainly by burning fossil fuels.
Combustion is the main source of air pollution. Further, combustion of fossil fuel is the major source of CO2 emission! • Human society is developing rapidly, consuming quickly fossil fuels because of population growth, rising of living standard, urbanization, globalization. The crisis is foreseeable. High oil price will continue … so that we are alerted: “Limit of Development”, “Only One Earth”!
Energy Principles • Energy is defined in thermodynamics, as the ability of doing work. Work is often referred to as the action, with which a result will be produced which has the same effect as that a weight is lifted for a certain height. • Therefore, if a substance or a system possesses energy, it should have the ability of lifting weight. And when the work is done, the energy of the substance or the system will lose the corresponding amount of (useful) energy. However, according to thermodynamics, energy cannot be created or destroyed, then where is the lost useful energy?
Forms of energy Conventional: • Mechanical • Kinetic (rotation, translation, vibration) • Potential (elevation, separation between..) • Thermal • Sensible heat (temperature) • Latent heat (phase transform) • Chemical • ionic bond • covalent bond • Atomic • Electric • Electro-magnetic, light, solar
Types of energy sources • Fossil fuels: coal, oil, gas • Solar • Hydraulic • Tidal • Wave • Wind • Biomass • Geothermal • Nuclear • Electricity • Hydrogen Primary and secondary energies? Energy & energy sources?
Photosynthesis: Trees convert solar radiation to chemical with the efficiency 6 ~ 10% Photovoltaic module: 10 ~20% Energy efficiency
The two thermodynamic laws • The First law: In all physical and chemical changes, energy is neither created nor destroyed, but it may be converted from one form to another: We cannot get something for nothing in terms of energy quantity • The Second law: Whenever energy is changed from one form to another we always end up with less usable energy than we started with: Energy always goes from a more useful to a less useful form when it is changed from one form to another. • Does this mean “more useful energy” is not conserved? • But, how do we define “more useful”?
The second law of thermodynamics • When energy is converted from one form to another, there is no loss of total energy, but there is a loss of useful energy; • The energy that cannot do work is called entropy; • When energy is converted from one form to another, entropy increases; • Another way to consider, entropy is a measure of disorder and that the amount of disorder increases when energy conversions take place.
Don’t forget there were “Perceptual motion machines” In 13th century of Europe: among the 12 bars, the rights are more distant than the lefts so that the rotating momentum of the rights should be larger than that generated by the lefts … The second kind of perpetual motion machine The first kind of perpetual motion machine If heat can be transferred from the ocean or the atmosphere to do work… The thermal energy contained in the oceans and atmosphere is infinite, so that …
Circular Economy • Change to a Matter-Recycling-and-Reuse Economy is an important way to slow down resource use and environmental degradation. However, the two thermodynamic laws tell us that recycling and reusing matter resources always require using high-quality energy and matter that cannot be recycled and adds waste heat to the surrounding environment. • The law for circular economy promotion of China was issued in August and to be put in force on Jan 1st 2009.
History of energy consumption • History shows that complex industrial societies use the most energy. If societies are to survive, they must continue to expend energy. However, they may need to change their pattern of energy consumption as traditional sources become limited. • Biological energy sources • The sun provide the most energy. • The first transfer of energy occurs during photosynthesis, when plants convert light energy into chemical energy in the production of food. • Plants and animals are energies as food, tools, and fuel • Wood provided a source of fuel for heating and cooking • The controlled use of fire was the first use of energy in a form other than food.
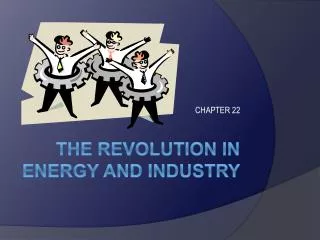
Fossil fuels and the industrial revolution • The first fossil fuel used extensively is coal, early eighteenth century • The first Industrial revolution, invention of machines that replaced human and animal labor. invention of steam engine. “Nations without a source of coal or those possessing coal reserves that were not easily exploited did not participate in the (first) Industrial Revolution.” • 1859, the beginning of the modern petroleum era, Automobile industry • 1870 ~ the second industrial revolution • Invention of electricity • Invention of internal combustion engine • Electric communication • After 1900, development of oil production • Globalization ~ oil and transportation
Energy and Economics • Economic growth and energy consumption • Economic growth and the availability of inexpensive energy. • The replacement of human and animal energy with fossil fuels began with the Industrial Revolution and was greatly accelerated by the supply of cheap, easy-to-handle, and highly efficient fuels. • World War II was the prime factor in ending the economic depression of the 1930s; • After World War II. Consumer goods that had been unavailable during the War were in great demand. …a supply of inexpensive energy encouraged a period of rapid economic growth. • In Europe and Asia, people had to build new infrastructures, facilities, industries…
The role of automobiles • Automobile, road… A cycle of more chasing more has begun: More cars mean more jobs in the automobile industry, the steel industry, the glass industry, and hundreds of other industries. Constructing road created additional jobs. Oil companies grew from lamp oil suppliers to one of the largest industries in the world. Cars become a necessity from a luxury. • Cars also alter people’s lifestyles: Travel longer distances, motels, shopping centers, people move to suburbs, labor saving and energy consuming devices…11% of the electric energy in North America is spent to operate home appliances. The small. horse-powered, family-owned farm of yesterday has grown into huge, diesel-powered corporate farms of today. --- How our lifestyles are based on a continuing supply of cheap, abundant energy.
Oil Price Issues • Two major factors: the cost of purchasing and processing crude oil into gasoline; and various taxes • Government is to collect money to build and repair roads. • Crude oil price?
Energy Sources • Fossil fuels: coal, oil and natural gas • Formed hundreds of millions of years ago • Accumulation of energy – rich organic molecules produced by organisms as a result of photosynthesis over millions of years. – nonrenewable • Renewable energies: solar, geothermal, tidal, and biomass…
Resource and reserves • A resource is a naturally occurring substance of use to humans that can potentially be extracted using current technology;Reservesare known deposits from which materials can be extracted profitably with existing technology under certain economic conditions.
卡诺循环 (Carnot cycle) 燃料电池 (Fuel cell)
Are fuel cells the future? • Hydrogen used to power the cell is difficult to obtain in a pure state; • Pure hydrogen is highly flammable, difficult to store… • Hydrogen economy?
An energy flow chart • Proved reserve • Energy production • Energy carrier • Energy end user
Notes: • The current capacity of energy carriers is shown by the width of the lines. • Further energy conversion steps may take place in the end-use sectors, such as the conversion of natural gas into heat and/or electricity on site at the individual consumer level. • ‘Buildings’ include residential, commercial, public service and agricultural. • Peat is included with coal. Organic waste is included with biomass. • The resource efficiency ratio by which fast-neutron technology increases the power-generation capability per tonne of natural uranium varies greatly from the OECD assessment of 30:1. In this diagram the ratio used is up to 240:1. • Comparisons can be made with SRES B2 scenario projections for 2030 energy supply, as shown in Figure 4.26.
Oil and coal ~81%, combustible biomass/wastes~10%. • ~ 40% of global primary energy was used to generate 17,408 TWh of electricity, with an average growth rate of 2.8%/yr since 1995 and is expected to continue growing at a rate of 2.5–3.1%/yr until 2030. • For electricity, in 2005, hard coal and lignite fuels ~ 40%; natural gas ~ 20%, nuclear 16%, hydro 16%, oil 7% and other renewables 2.1% • Non-hydro renewable energy power plants have expanded substantially with wind turbine and solar PV installations growing by over 30% annually, still supply only a small portion of electricity generation
Many consumers of petroleum and natural gas depend to varying but significant amounts of fuels imported from distant, often politically unstable regions of the world and transported through a number of locations equally vulnerable to disruptions. • For example, in 2004 16.5–17 Mbbl/d of oil was shipped through the Straits of Hormuz in the Persian Gulf and 11.7 Mbbl/d through the Straits of Malacca in Asia. A disruption in supply at either of these points could have a severe impact on global oil markets. Political unrest in some oil and gas producing regions of Middle East, Africa and Latin America has also highlighted the vulnerability of supply. When international trade in oil and gas expands in the near future, the risks of supply disruption may increase leading to more serious impacts. This is a current driver for shifting to less vulnerable renewable energy resources.
From 1900 to 2000, world primary energy increased more than ten-fold, while world population rose only four-fold from 1.6 billion to 6.1 billion. • Most energy forecasts predict considerable growth in demand in the coming decades due to increasing economic growth rates throughout the world but especially in developing countries. ! • Global primary-energy consumption rose from 238 EJ in 1972 to 464 EJ in 2004 (32 years). • During the period 1972 to 1990, the average annual growth was 2.4%/yr, dropping to 1.4%/yr from 1990 to 2004 due to the dramatic decrease in energy consumption in the former Soviet Union and to energy intensity improvements in OECD countries. The highest growth rate in the last 14 years was in Asia (3.2%/yr).
Low electrification rates correlate with slow socio-economic development. • Middle East, North Africa, East Asia/China and Latin America ~ over 85% of their populations, whereas sub-Saharan Africa is only 23%, and South Asia is 41% • Large discrepancy between primary energy consumption per capita • N-America ~ 336 GJ/yr ; African ~ 26 GJ/yr • Lowest per-capita consumption Asian in 1972 to African countries today.
150.0 155.4 7400 6700 2004 2030 Solar 0.8 41 Wind 0.7 2.5 Biomass 49.5 61.2 Geotherm 0.9 1.8 Hydro 10.2 14.9 Nuclear 29.8 19.2 172.3 205.8 121.3 179.4 100,000 98,000 110.5 79.8 95.3 204.7 10,800 9,400 0.0 18.2 105.1 178.0 13,500 9,500 5,300 11,000 10.6 39.8 185 235.3 82.4 139.2 10,000 4,600 10,200 11,200 Energy flow comparison between 2004 and 2030 Projected energy flow in 2030
Oil Coal Natural gas Cited from BP2011
World nuclear power consumption since 1965, according to BP-2011
World solar energy consumption since 1996, according to BP-2011
World wind power consumption since 2003, according to BP-2011
World primary energy consumption since 1965, according to BP-2011
World primary energy consumption by fuel in 2005~2010 In million toe
Million tonnes oil equivalent Energy consumption structure in 2010 --- Based on BP world energy statistics 2011 China burns coal more than 3 times than that by US and more than 6 times than that by India.
Figure 1.5: Intensities of energy use and CO2 emissions, 1970–2004. PPP ~ Purchasing Power Parity TPES ~ Total Primary Energy Supply