Filtering Problem
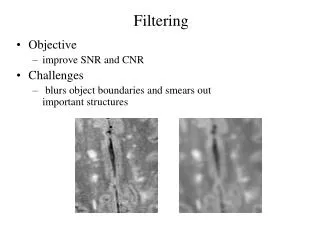
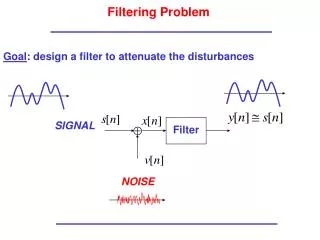
Filtering Problem. Goal : design a filter to attenuate the disturbances. Filter. SIGNAL. NOISE. SIGNAL. NOISE. Mostly NOISE. Mostly NOISE. Define Signal and Noise in the Frequency Domain. NOISE. Filter. SIGNAL. Mostly SIGNAL. PASS Band. STOP Band. IDEAL Filter.

Filtering Problem
E N D
Presentation Transcript
Filtering Problem Goal: design a filter to attenuate the disturbances Filter SIGNAL NOISE
SIGNAL NOISE Mostly NOISE Mostly NOISE Define Signal and Noise in the Frequency Domain NOISE Filter SIGNAL Mostly SIGNAL
PASS Band STOP Band IDEAL Filter Since the filter has real coefficients, we need only the positive frequencies
PASS Band STOP Band Trans. Band Non-IDEAL Filter Since the filter has real coefficients, we need only the positive frequencies
Design a Low Pass Filter: IDEAL First we can determine an infinite length expansion using the DTFT:
Design a Low Pass Filter: IDEAL (continued) This means the following. If then
From IDEAL to FIR Notice that Then we can approximate with a finite sum… … and choose the filter as actual desired
Summary of design of Low Pass FIR Given the Pass Band Frequency The impulse response of the filter: let Magnitude and Phase: Magnitude: Phase: in the passband
Example of Freq. Response n=0:N; h=(wp/pi)*sinc((wp/pi)*(n-L)); freqz(h)
Impulse Response n=0:N; stem(n,h)
Example with Hamming window hamming window n=0:N; h0=(wp/pi)*sinc((wp/pi)*(n-L)); h=h0.*hamming(N); stem(n,h)
Example with Hamming window hamming window freqz(h) ~ 50dB
attenuation Rectangular -13dB Hamming -43dB Blackman -58dB transition region Low Pass Filter Design: Analytical Transition Region: depends on the window and the filter length N Attenuation: depends on window only
Example of Low Pass Filter Design Specs: Pass Band 0 - 4 kHz Stop Band > 5kHz with attenuation of at least 40dB Sampling Frequency 20kHz Step 1: translate specifications into digital frequency Pass Band Stop Band Step 2: from pass band, determine ideal filter impulse response
Example of Low Pass Filter Design (continued) Step 3: from desired attenuation choose the window. In this case we can choose the hamming window; Step 4: from the transition region choose the length N of the impulse response. Choose an even number N such that: So choose N=80 which yields the shift L=40.
Example of Low Pass Filter Design (continued) Finally the impulse response of the filter
Example of Low Pass Filter Design (continued) The Frequency Response of the Filter:
Design Parameters Pass Band Frequency rad. Stop Band Frequency rad. Pass Band Ripple dB Stop Band Attenuation dB
Linear Interpolation Computer Aided Design of FIR Filters Best Design tool for FIR Filters: the Equiripple algorithm. It minimizes the maximum error between the frequency responses of the ideal and actual filter. Step 1: define the desired filter with pairs of frequencies and values. For a Low Pass Filter: f=[0, f1, f2, 1]; A=[1, 1, 0, 0]; where
Computer Aided Design of FIR Filters Step 2: Choose filter length N from desired attenuation as Step 3: call “firpm” (pm = Parks, McClellan) h = firpm(N, f, A); which yields the desired impulse response
Example: Low Pass Filter Passband: 3kHz Stopband: 3.5kHz Attenuation: 60dB Sampling Freq: 15 kHz Then compute: h = firpm(82,[0,2/5,7/15,1], [1,1,0,0]);
Frequency Response freqz(h) 50dB, not quite yet! Increase N.
Increase Filter Length N h=firpm(95, [0, 2/5, 7/15, 1], [1,1,0,0]); freqz(h)
Impulse Response of Example stem(h)
Typical Applications In applications such as Radar, Sonar or Digital Communications we transmit a Pulse or a sequence of pulses. For example, we transmit a short sinusoidal burst:
0 1 1 0 Typical Applications For example in a communications signal we send “0” and “1”. For example let: Transmitted:
Received Signal with Noise Suppose you receive the signal with 0dB SNR:
dB Hz DTFT of Signal Magnitude of the DFT of the Pulse (in dB):
DTFT of Signal Bandwidth of the Signal (take about -20dB from max) is about 1.0kHz
Design the Low Pass Filter Pass 0 to 1kHz; Stop 1.5kHz to 10.0kHz Sampling Freq 20.0kHz Attenuation 40dB N=81
Filtered Data Received signal: … and Filtered: Compare to the original: