Download
1 / 8
80 likes | 194 Views
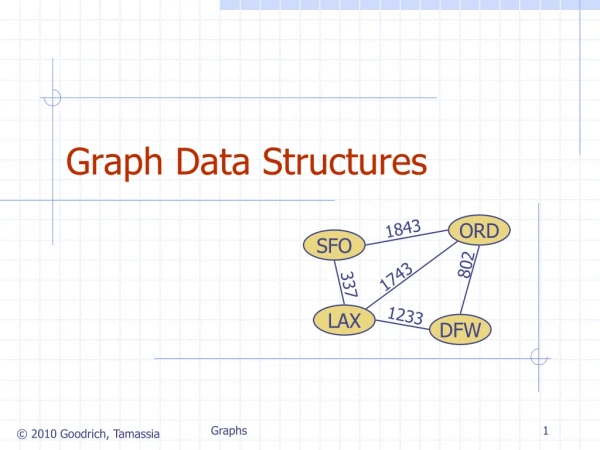
Data and Probability Learning to Graph. Ms. Buckler Third Grade Mathematics. Standards and Objectives. Students will learn how to organize and interpret data Students will make predictions about data Students will represent data in sets

E N D
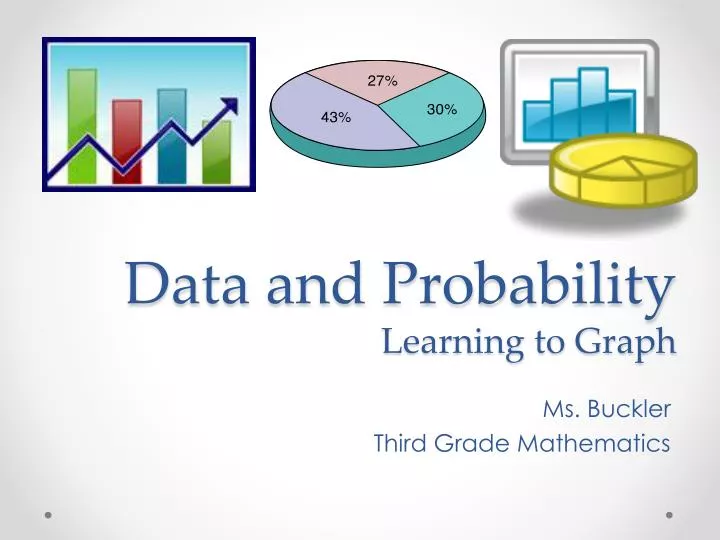
Data and ProbabilityLearning to Graph Ms. Buckler Third Grade Mathematics
Standards and Objectives • Students will learn how to organize and interpret data • Students will make predictions about data • Students will represent data in sets • Students will learn the basic concepts of probability South Carolina Standards: 3-6.2, 3-6.3, 3-6.4, 3-6.5, 3-6.6
Questions? • What is probability? • When should we use graphs? Probabilityis the relative possibility that an event will occur, as expressed by the ratio of the number of actual occurrences to the total number of possible occurrences. Graphsgive a visual representation of our data and they are much easier to see than just looking at numbers • Population, Age, Gender, Birthdays, Favorites, etc.
What Is Your Favorite Fruit? Let’s collect data from our class. We have 30 Students in our classroom, let’s see which fruit is everyone’s favorite…. • Strawberries: _____ of us love strawberries! • Bananas: _____ of us love B-A-N-A-N-A-S! • Oranges: We may eat these during our soccer games, but only _____ of us chose them as our favorite! • Grapes: Red or green, _____ of us love grapes! • Watermelon: Our summertime favorite fruit, but only _____ of us love to eat it all the time! 10 4 3 5 8 Using our data we found, let’s construct a bar graph…
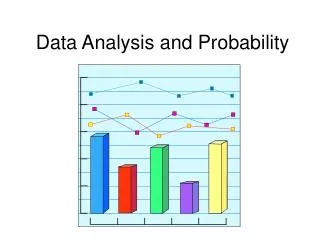
What Is Your Favorite Fruit? This shows us our data using a bar graph.
Now let’s look at a Pie Chart… This shows us our data using a pie graph or pie chart. We show the amount that is represented along with the percentages out of a whole. Example: What is the percentage of who likes strawberries? 33% of students’ favorite fruit is strawberries.
Vocabulary Probability • ___________________ is the possibility that an event will occur. • __________________ are graphs using parallel bars of varying lengths. • ___________________ are a graphic representation of quantitative information by means of a circle divided into sectors (sometimes include percentages) • We use _______ to construct our graphs. Bar Graphs Pie Graphs/Charts data
Still need some help? Watch this video that shows how to make a bar graphgiven the same data thatwas found and recorded in different ways.