Download
1 / 31
310 likes | 447 Views
Beam loss and its mitigation in the J-PARC RCS Space charge 2013 April 16-19, 2013 @ CERN. Hideaki Hotchi (J-PARC), RCS beam commissioning team & Shinji Machida (RAL). J-PARC (JAEA & KEK). 400 MeV H - Linac [181 MeV at present].

E N D
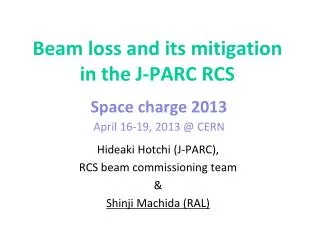
Beam loss and its mitigationin the J-PARC RCSSpace charge 2013April 16-19, 2013 @ CERN Hideaki Hotchi (J-PARC), RCS beam commissioning team & Shinji Machida (RAL)
J-PARC (JAEA & KEK) 400 MeV H- Linac [181 MeV at present] 3 GeV Rapid Cycling Synchrotron (RCS) Neutrino Beam Line to Kamioka(NU) Materials & Life Science Facility (MLF) 50 GeV Main Ring Synchrotron (MR) [30 GeV at present] JFY 2006 / 2007 JFY 2008 Hadron Experimental Hall (HD) JFY 2009
Design parameters of the J-PARC RCS H- Linac upgrade : - Installation of ACS in 2013 Summer-Autumn: Injection energy 181 MeV ⇒ 400 MeV - Replacement of IS and RFQ in 2014 Summer: Intensity 5.0E13 ⇒ 8.3E13/pulse We plan to start 1-MW beam tuning from Oct. 2014.
History of the RCS output beam power • Beam commissioning of the linac ; November 2006~ • Beam commissioning of the RCS ; October 2007~ • Startup of the MLF user operation ; December 2008~ Summer shutdown Summer shutdown Summer shutdown 540-kW demo Recovery from damages caused by East Japan earthquake 300 kW 300-kW demo Output power to MLF (kW) 210 kW 210 kW 120 kW 20 kW 4 kW The RCS output beam power has been steadily increasing following; - Progression of beam tuning, - Hardware improvements, - Careful monitoring of the trend of residual activation levels. - Maximum output beam power demonstrated so far : ~540 kW - Current output beam power for the routine user program : ~300 kW *** Output beam power is now limited by the capability of the neutron target.
High intensity beam trial of up to 540 kW • Date ; Nov. 2012 • Injection beam; • 181 MeV/24.5 mA/0.5 ms/0.60 chopper beam-on duty factor • ⇒ 4.5E13/pulse, corresponding to 540 kW outputat 25 Hz. • Operating point; (6.45, 6.42) In this experiment, we measured; - Injection painting parameter dependence of beam loss - Intensity dependence of beam loss - Time structure of beam loss - Transverse & longitudinal beam profiles, and bunching factor . . . . . . In this talk, we present the above experimental results together with the corresponding numerical simulation results.
Transverse painting Transverse painting makes use of a controlled phase space offset between the centroid of the injection beam and the ring closed orbit to form a different particle distribution of the circulating beam from the multi-turn injected beam. Horizontal painting by a horizontal closed orbit variation during injection Vertical painting by a vertical injection angle change during injection “Correlated painting” etp= 0~216pmm mrad
M. Yamamoto et al, NIM., Sect. A 621, 15 (2010). F. Tamura et al, PRST-AB 12, 041001 (2009). Longitudinal painting Longitudinal painting makes use of a controlled momentum offset to the rf bucket in combination with superposing a second harmonic rf to get a uniform bunch distribution after the multi-turn injection. Momentum offset injection RF voltage pattern Fundamental rf V1 RF voltage (kV) V2 Second harmonic rf Time (ms) Dp/p=0, -0.1 and -0.2% V2/V1=80% The second harmonic rf fills the role in shaping flatter and wider rf bucket potential, leading to better longitudinal motion to make a flatter bunch distribution. Uniform bunch distribution is formed through emittance dilution by the large synchrotron motion excited by momentum offset.
Longitudinal painting Additional control of longitudinal painting ; phase sweep of V2 during injection Vrf=V1sinf-V2sin{2(f-fs)+f2} Phase sweep of the second harmonic rf V2/V1=0 V2/V1=80% f2=-100 deg f2=-100⇒0 deg f2=-50 deg f2=0 RF potential well (Arb.) The second harmonic phase sweep method enables further bunch distribution control through a dynamical change of the rf bucket potential during injection. f (Degrees)
Numerical simulation setup • Simpsons (PIC particle tracking code developed by Dr. Shinji Machida) • Imperfections included: • Time independent imperfections • - Multipole field components for all the main magnets: • BM (K1~6), QM (K5, 9), and SM (K8) obtained from field measurements • - Measured field and alignment errors • Time dependent imperfections • - Static leakage fields from the extraction beam line: • K0,1and SK0,1 estimated from measured COD and optical functions • - Edge focus of the injection bump magnets: • K1 estimated from measured optical functions • - BM-QM field tracking errors • estimated from measured tune variation over acceleration • - 1-kHz BM ripple • estimated from measured orbit variation • - 100-kHz ripple induced by injection bump magnets • estimated from turn-by-turn BPM data • Foil scattering: • Coulomb & nuclear scattering angle distribution calculated with GEANT Time-dependent imperfections can be included easily, because “Simpsons” takes “time” as an independent variable. We improve calculation model following the progression of beam experiment in collaboration with Dr. S. Machida, discussing space-charge effect and its combined effects with imperfections.
Transverse painting Numerical simulations Transverse beam distribution just after beam injection (at 0.5 ms) No painting Horizontal Vertical x‘ (mrad) y‘ (mrad) y (mm) Density (Arb.) x (mm) Position (mm) y (mm) x (mm) Density (Arb.) x‘ (mrad) y‘ (mrad) y (mm) x (mm) Position (mm) y (mm) x (mm) 100ptransverse painting
Longitudinal painting Longitudinal beam distribution just after beam injection (at 0.5 ms) V2/V1=80% f2=-100 to 0 deg Dp/p=-0.1% V2/V1=80% f2=-100 to 0 deg Dp/p= 0.0% No longitudinal painting V2/V1=80% f2=-100 to 0 deg Dp/p=-0.2% Dp/p (%) Dp/p (%) Dp/p (%) Dp/p (%) f (degrees) f (degrees) f (degrees) f (degrees) Bf=0.40 Bf=0.15 Density (Arb.) Density (Arb.) Density (Arb.) Density (Arb.) f (degrees) f (degrees) f (degrees) f (degrees) Measurements (WCM) Numerical simulations
Tune footprint at the end of injection Numerical Simulation - No transverse painting - No longitudinal painting - 100p transverse painting - Full longitudinal painting (V2/V1=80%, f2=-100 to 0 deg, Dp/p=-0.2%) 2x+2y=24 x+2y=18 nx nx x-2y=-6 2x-2y=0 ny ny Particles here suffer from emittance dilutions, leading to beam loss.
Emittance growth mitigation by painting 99 % normalized emittance 1 Data ID By longitudinal painting 3 4 Horizontal By adding 100p transverse painting 5 ex (p mm mrad) 8 Numerical Simulation Data ID 1 3 Vertical 4 5 ey (p mm mrad) 8 Numerical Simulation Time (ms) We experimentally investigated the effectiveness of injection painting on the beam loss reduction for 540 kW intensity beam.
Beam loss reduction by painting ―Measurements (DCCT) ― Calculations ID 1 ID 2 ID 3 ID 4 ID 5 Number of particles/pulse ( x 1013) ID 8 ID 6 ID 7 Min. loss:~2% ID 10 ID 11 ID 9 Time (ms) - Beam loss takes place only for the first 4 ms in the low energy region for all the cases. - Beam loss of ~30% observed with no painting (ID1) was decreased to ~2% by the combination of 100p transverse painting and full longitudinal painting (ID8). - Most of the remaining 2% beam loss was well localized at the collimator section. - The 2% beam loss corresponds to 650 W in power, which is still less than 1/6 of the collimator limit of 4 kW.
Beam loss reduction by painting Beam survival: output intensity (DCCT) /input intensity (SCT76) By adding 100p transverse painting By longitudinal painting Beam survival Min. loss:~2% Max. output: 539 kW No painting ●Measurements ○ Calculations Painting parameter ID ID1⇒ID8 Beam loss reduction by painting ID8⇒ID11 Beam loss increase caused by large transverse painting (etp>150p) due to the dynamic aperture limit.
Intensity dependence of beam loss, bunching factor, extraction beam profile・・・
Measurements vs. Calculations : Bunching factor ― Calculations 539 kW (500 ms) 433 kW (400 ms) 326 kW (300 ms) 217 kW (200 ms) Bunching factor Time (ms) 104 kW (100 ms) Time (ms)
Measurements vs. Calculations : Time structure of beam loss Calculations Scintillation type BLM @ Collimator (A) 539 kW (500 ms) (B) 433 kW (400 ms) 326 kW (300 ms) SBLM signal (Arb.) 217 kW (200 ms) # of lost particles/turn 104 kW (100 ms) Normalized to be 2% Beam loss (%) Beam loss (%) 0.7 ms : End of foil scattering Time (ms) 0.7 ms : End of foil scattering Time (ms) The beam loss appears only for the first 4 ms in the low energy region: (A) mainly from foil scattering during injection (B) Origin? ・・・to be discussed later
Measurements vs. Calculations : Intensity dependence of beam loss Beam survival : ratio of output intensity (DCCT) to input intensity (SCT76) Painting parameterID8 : - 100p transverse painting - Full longitudinal painting 539 kW (Li pulse 500 ms) ●Measurements ○Calculations 433 kW (Li pulse 400 ms) 325 kW (Li pulse 300 ms) 433 kW 217 kW (Li pulse 200 ms) 104 kW (Li pulse 100 ms) Beam survival 539 kW 217 kW 326 kW 104 kW Li pulse length (ms)
Measurements vs. Calculations : Extraction beam profile at 3 GeV MWPM @ extraction beam line Vertical Horizontal 539 kW (500 ms) ― Calculations Intensity dependence of RMS beam width 433 kW (400 ms) ●Measurements ○Calculations Charge density (Arb.) 326 kW (300 ms) Vertical RMS width (mm) 217 kW (200 ms) Horizontal 104 kW (100 ms) Li pulse length (ms) Position (mm)
Discussions for ~2%-loss remaining for 540-kW intensity beam
Possible causes of ~2-% loss remaining for 540-kW intensity beam Calculations ~2.5% 539 kW (500 ms) Includes all imperfections D~+1.6% by 100-Hz ripple induced by injection bump magnets ~0.9% D~+0.3% by 1-kHz BM ripple; collimator aperture reduction caused by orbit variation # of lost particles/turn Beam loss (%) ~0.6% D~+0.5% by foil scattering ~0.1% Time (ms) 0.7 ms : End of foil scattering
100-kHz resonance ripple induced in the ceramic vacuum vessel screening strips by injection bump field FFT of BPM signal b side-band peak frev x 5 Horizontal Side-band peak excited by 100-kHz ripple Power (dB) Frequency (MHz) Time structure of the side-band peak power Flattop Fall time of injection bump Horizontal Vertical Kick angle of ripple (mrad) This fast ripple excites additional betatron resonances at 0.2 (0.8) during injection (first ~1 ms). ~100 kHz Time (ms)
Effect of 100-kHz ripple Tune footprint calculated at the end of injection nx 326 kW (300 ms) 217 kW (200 ms) 104 kW (100 ms) Present operating point 0.2 0.2 0.2 0.2 0.2 0.2 Core on 0.2 lines • 100-kHz ripple makes additional • betatron resonances at 0.2 (0.8). • A part of beam particles reaches to • 0.2 lines due to space-charge • tunedepression, • where the effect of ripple builds up, • leading to emittance growth. 433 kW (400 ms) 539 kW (500 ms) 0.2 0.2 0.2 0.2 Tail on 0.2 lines ny The situation for higher intensity beam is more severe, because the 100-kHz ripple directly affect the tail part of the beam.
Effect of 100-kHz ripple Beam profile calculated at the end of injection (plotted in log scale) Horizontal Vertical 104 kW ― Without 100-kHz ripple ―With 100-kHz ripple 217 kW Larger beam halo/tail formation takes place for higher intensity beam, leading to beam loss. 326 kW Charge density (Arb.) 433 kW 539 kW x (m) y (m)
Re-optimization of operating point • OP1 : Current operating point • - Systematic resonances of n=6, • 2nx+2ny=24and nx+2ny=18 • strongly affect the beam, • though their effects can be mitigated • sufficiently by painting. • - 100-kHz ripple (0.2 resonances) • also strongly affect the beam. • OP2 : Alternate operating point • - Half integer lines of n=5.5 can affect • the beam, but the effect of low-order • systematic nonlinear resonances (3rd & 4th) • can be decreased. • - No chromatic correction is necessary. • - Larger dynamic aperture • ⇒ Larger transverse painting • (150p) is available. • - Effect of 100-kHz ripple • (0.8 resonances in this case) is less. OP1 OP2
OP1 vs. OP2 : Time structure of beam loss Numerical simulations OP2, 150p transverse painting + full longitudinal painting OP1, 100p transverse painting + full longitudinal painting ・・・Foil fitting rate reduction by larger transverse painting ・・・Mitigation of 100-kHz-ripple -induced emittance growth # of lost particles/turn # of lost particles/turn Beam loss (%) Beam loss (%) Time (ms) Time (ms) 0.7 ms : End of foil scattering 0.7 ms : End of foil scattering We will try “OP2” in the next high intensity trial experiment (Apr. 15-20).
OP1 vs. OP2 : Effect of 100-kHz ripple Tune footprint calculated at the end of injection nx nx OP1 0.2 0.8 OP2 0.2 0.8 Less particles on 0.8 lines ny ny Beam profile calculated at the end of injection ー No 100 kHz ripple ー With 100 kHz ripple Horizontal Horizontal Halo/tail formation caused by 100-kHz ripple can be mitigated at “OP2”. Charge density (Arb.) Charge density (Arb.) Vertical Vertical Position (m) Position (m)
Reference: H. Hotchi, et. al., Phys. Rev. ST Accel. Beams 15, 040402 (2012). Summary 1) Modeling of high intensity proton synchrotron and quantitative benchmarking between experiment and simulation becomes feasible. 2) Key factors are, to include all known imperfections in addition to the correct modeling of transverse and longitudinal dynamics, injection process, space charge tune spread, etc. 3) Several beam loss mitigation idea were proposed with help of simulation and verified by experiment. 4) Based on the study, there is a good reason that we could use simulation as a tool of the performance improvement in future.