Download

1 / 14
140 likes | 254 Views
GATOR Team Meeting. Alex Bryan 30 July 2008. Outline. Methodology to recent work 5 August 2007: Bouncing balloon case MODIS Cloud Product Meteorological Validations (Dropsonde comparison) Aircraft and satellite product comparison UV-DIAL (DC-8) CPL (ER-2) SSFR (ER-2) What’s next?.

E N D
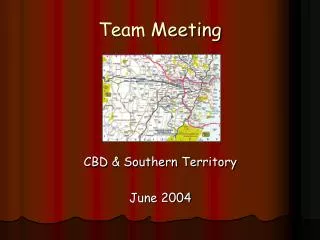
GATOR Team Meeting Alex Bryan 30 July 2008
Outline • Methodology to recent work • 5 August 2007: Bouncing balloon case • MODIS Cloud Product • Meteorological Validations (Dropsonde comparison) • Aircraft and satellite product comparison • UV-DIAL (DC-8) • CPL (ER-2) • SSFR (ER-2) • What’s next?
Recent Work • Methodology • Tag convective days • Tag aircraft flyby days • Pull flight plans, flight reports, useful data sets and images from TC4 data archive • http://espoarchive.nasa.gov/archive/arcs/tc4/ • Compare ozonesonde profiles with aircraft and satellite products
Bouncing Balloon Case Study5 Aug 2007 Figure 1a, b, and c The vertical flight track and temporal change in ozone MR (above), local radar image at mid-point of oscillations (right top), and the flight track of the balloon (right bottom).
MODIS Cloud Product5 Aug 2007 Figure 2 MODIS confirms the presence of convection through the dense cloud feature atop the NATIVE site location in Las Tablas, Panama. The aircraft’s main focus at the time was a convective area just south of Panama. The MODIS image was taken at 1600 Z, the median of the time range in the balloon’s oscillations. Source: K. Strabala, Wisconsin CIMSS; ER-2 flight report (5 Aug 2007)
Meteorological ValidationDropsonde vs. Ozonesonde Launch lat: 7° 46.00‘ W Launch long: 80° 15.00‘ N Launch time: 15:05:16 UT Launch lat: 6° 29.30‘ N Launch long: 79° 44.50‘ W Launch time: 14:59:03 UT Figure 3a and b Near proximity dropsonde launched at just under 13 km correlates positively with NATIVE ozonesonde launch, as evident in the minor capping inversion at 800 mb marking a level of instability. (NOTE: the difference in the geographical placement of the sondes could account for the weaker-than-expected appearance of the instability, considering what convection is apparent by the ozonesonde’s oscillatory behavior.
Meteorological ValidationDropsonde vs. Ozonesonde Launch lat: 7° 46.00‘ W Launch long: 80° 15.00‘ N Launch time: 15:05:16 UT Launch lat: 6° 29.30‘ N Launch long: 79° 44.50‘ W Launch time: 14:59:03 UT Figure 4a and b Near proximity dropsonde launched at just under 13 km correlates positively with NATIVE ozonesonde launch, as also evident in the distinct low-moisture feature at 800 mb, which can be identified clearly in both profiles.
Significance of Vertical Wind Shear5 Aug 2007 Figure 5 Backing winds with height from 850-750 mb indicate cold air advection and a resultant subsidence, which may confirm the existence of an outflow region associated with the surrounding convection. This may also confirm the presumption that the oscillations in the balloon track are primarily influenced by said outflow region. The dynamic drop in wind speed just above 800 mb may signify the location of the boundary between the convection at the top of the boundary layer and the free troposphere. See Folkins and Martin 2004
Aircraft Flight Tracks5 Aug 2007 Figure 6 Intended flight tracks for the DC-8 (left), ER-2 (center), and WB-57 (right) • Racetracks just south of Panama bight (time nearest NATIVE site) • DC-8: 1345 – 1600 UT (1830 UT) • ER-2: 1330 – 1630 UT (1630 UT) • WB-57: 1430 – 1600 UT (1400 UT)
UV-DIAL Validation Figure 7a and b Ozonesonde profile (b) confirms the validity of UV-DIAL based ozone mixing ratio profiles (a) aboard the DC-8 aircraft. This was produced while the DC-8 was in ‘near’ proximity with the NATIVE site on 13 Jul.
CPL Validation Figure 8 The CPL (Cloud Physics Lidar) aboard the ER-2 reportedly shows a persistent presence of high cirrus tops at 14 – 15 km throughout the entirety of the flight on 5 Aug. The density of such features may indicate high-altitude convection through the formation of cirrocumulus clouds aloft. By their high sunlight reflectivity (albedo), this can validate the high albedo features present in the SSFR model in the next slide. LAUNCH
SSFR Validation Figure 9a, b and c Using the valuable data from the shadowband and MICROTOPS instruments aboard NATIVE during TC4 could be useful validation tools against NASA’s SSFR (Solar Spectral Flux Radiometer) as a device for measuring solar spectral irradiance, which can tell the radiative effect of clouds, aerosols, and gases on climate, and also to infer the physical properties of aerosols and clouds.
Next up… • Further analysis with… • UV-DIAL images for other convective cases • CPL and MODIS comparisons • SKEW-T and vertical wind profiles for all days • More convective cases coinciding with aircraft fly-bys! • 21 July 2007 (sneak peak: next slide) • Rough write-up as contribution toward TC4 final paper • “Convective and wave signatures in ozone profiles over the Panama Bight in July-August 2007”