Download
1 / 14
220 likes | 1.02k Views
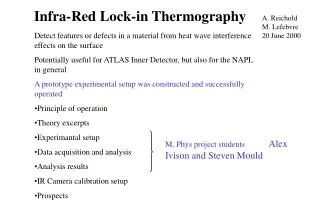
A. Reichold M. Lefebvre 20 June 2000. Infra-Red Lock-in Thermography. Detect features or defects in a material from heat wave interference effects on the surface Potentially useful for ATLAS Inner Detector, but also for the NAPL in general

E N D
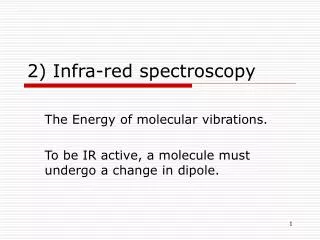
A. Reichold M. Lefebvre 20 June 2000 Infra-Red Lock-in Thermography • Detect features or defects in a material from heat wave interference effects on the surface • Potentially useful for ATLAS Inner Detector, but also for the NAPL in general • A prototype experimental setup was constructed and successfully operated • Principle of operation • Theory excerpts • Experimantal setup • Data acquisition and analysis • Analysis results • IR Camera calibration setup • Prospects M. Phys project students Alex Ivison and Steven Mould
Principle of Operation • a periodic heat flux is incident on the surface of interest • the surface temperature is measured and local variations in the phase and/or amplitude are sought heat IR camera measures surface temperature A. Reichold, M. Lefebvre
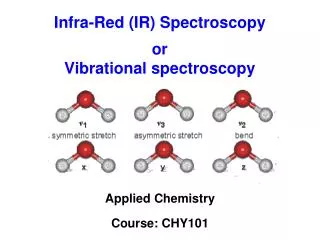
Theory excerpts Consider the simplest case where the object is an infinite plate of thickness l along x, and with the steady state boundary conditions We also assume heat transport via thermal conduction in the plate, that is no convection and no radiation. The problem is then, for the static case, A. Reichold, M. Lefebvre
Theory excerpts (continued) We find that the oscillatory part of the solution is proportional to where we recognise the forward and backward damped waves, where But to study the amplitude and phase of the x=0 surface temperature, it is more convenient to seek a solution of the form A study of the transient solution reveals a longest component lifetime to which we can associate a natural frequency of the object A. Reichold, M. Lefebvre
Theory excerpts (continued) At low frequency, the temperature spectrum follows the heat input. It acquires a p/4 phase lag at high frequency The amplitude decrease with frequency, as the surface temperature falls behind the heat input. The rate of change of the amplitude is maximum at the natural frequency A. Reichold, M. Lefebvre
1 2 3 4 Experimental Setup Bakelite object with “defects” DAQ control Labview glass PC ComputerBoards HV 30A 60V PowerTen 9 X 200W bulbs for a usable 1500W IR Camera Jenoptik Varioscan 3011-ST PC Jenoptik Varioscan software A. Reichold, M. Lefebvre
Data Acquisition and Analysis • M. Phys. Project Students: Alex Ivison and Steven Mould • DAQ under Labview control • sinusoidal heat source (frequency and amplitude) • IR camera trigger (number and relative phase) • T-probes (light array, glass, object) • Data taken: sets of 4 pictures for periods between 15 and 500s • Data analysis: extract amplitude and phase from each set of 4 pictures Labview analysis BMP file IR Camera IRBIS SID file ASCII file PC C++ analysis C++ A. Reichold, M. Lefebvre
Results Analysis of pictures of hole 2 with 120s period Phase picture Amplitude picture A. Reichold, M. Lefebvre
Results (continued) Hole 2, 120s, amplitude Hole 2, 150s, amplitude A. Reichold, M. Lefebvre
Results (continued) A. Reichold, M. Lefebvre
Results (continued) Compare with the theory for the infinite plates case with the following nominal quantities for bakelite The results are in qualitative agreement… clearly the experimental conditions are not infinite plates with constant temperature at the back! A. Reichold, M. Lefebvre
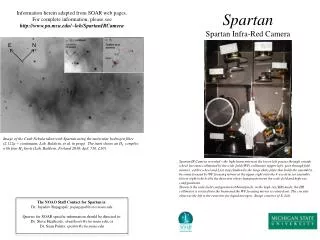
IR Camera calibration setup Need to obtain the relation between the camera ADC and the object temperature An isothermal box was designed and built An inner 1.5cm thick Al box surrounded by 15cm of isulation material, with one port for the camera (with shutter) and two ports for heating/cooling (with plugs). Blackbody suspended in the box, in the camera field of view. Under construction. Special paint ordered. T probes on the box inner face and on the blackbody. A. Reichold, M. Lefebvre
IR Camera calibration setup (continued) Views of the isothermal box A. Reichold, M. Lefebvre
Prospects • Very promising. • Next steps... • try with other materials (eg ATLAS ID carbon fibre) • improve experimental setup • redesign the light array (more power?) • build proper support for light array, glass, object • control interference from ambient conditions (cooling?) • allow for higher frequencies • finite difference analysis? • Continue C++ analysis code development (within ROOT?) • fully commission the isothermal box for IR camera calibration A. Reichold, M. Lefebvre