
D = AR
Figure 1: Cost Curves and Abnormal Profit. Price and costs. MC. ATC. ATC. MC. D = AR. MR. Quantity of Output. Figure 2: Cost Curves and Break Even/Shut Down. Price and costs. MC. ATC. AVC. ATC. MC. Break even. Shut down. Quantity of Output.

D = AR
E N D
Presentation Transcript
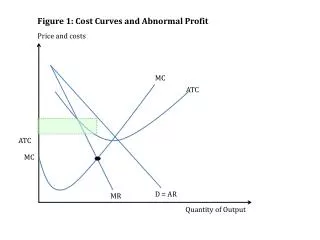
Figure 1: Cost Curves and Abnormal Profit Price and costs MC ATC ATC MC D = AR MR Quantity of Output
Figure 2: Cost Curves and Break Even/Shut Down Price and costs MC ATC AVC ATC MC Break even Shut down Quantity of Output
Figure 3: Dis/Economies of Scales and LRATC/SRATC ATC1 ATC2 ATC8 Average Total Cost ATC3 ATC7 LRATC ATC4 ATC5 ATC6 economies of scale (increasing returns to scale) diseconomies of scale (decreasing returns to scale) constant returns to scale Quantity of Output
Figure 4: Kinked Demand Curve Price Elastic P1 Stable Inelastic Q1 Quantity