Download
1 / 1
10 likes | 93 Views
Spectroscopic identification of AGN candidates from 3 lists, analyzing redshifts & luminosity functions for AGN evolution in the cosmic history. Methods include X-ray surveys, optical variability, and spectral analysis.

E N D
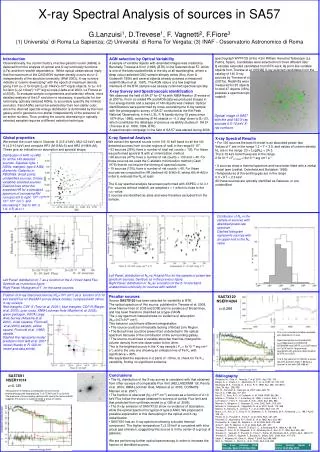
spectrograph WYFFOS at the 4.2m William Herschel Telescope (La Palma, Spain). Candidates were selected from three different lists: i) variable extended candidates from BTK work; ii) point-like variable objects from Trevese et al 1989 iii) X-ray selected candidates from the catalog of 140 X-ray sources by Trevese et al (2007a). Redshifts were measured for 25 objects. In total 47 objects (35%) possess a spectroscopic redshift. Introduction Observationally, the cosmic history of active galactic nuclei (AGNs) is deduced from the analysis of optical and X-ray luminosity functions (LFs) and their redshift dependence. While optical observations imply that the maximum of the QSO/AGN number density occurs at zM~2 independently of the absolute luminosity (Wolf 2003), X-ray surveys indicate a ”cosmic downsizing” with the epoch of maximum density going from zM~2 for bright (LX(2-10keV)>1045 erg/s) objects, to zM~0.5 for faint (LX(2-10keV)~1042 erg/s) ones (Ueda et al 2003, La Franca et al 2005). To evaluate sample completeness and selection effects, more detailed analysis of the LF evolution is necessary, in particular for low luminosity, optically selected AGNs, to accurately quantify the intrinsic evolution. Faint AGNs cannot be selected by their non-stellar color, since the oberved spectral energy distribution is dominated by the host galaxy and in general is non-stellar independently of the presence of an active nucleus. Thus, probing the cosmic downsizing in optically selected samples requires a different selection technique. AGN selection by Optical Variability A sample of variable objects with extended images was created by Bershady, Trevese & Kron (1998) (BTK) in the Selected Area 57, which is one of the best studied fields in the sky at all wavelengths, where a deep colour selected QSO sample already exists (Koo, Kron & Cudworth 1986) and several objects already possess a measured redshift (Munn et al. 1997). The AGN nature of a few brightest members of the BTK sample was already confirmed spectroscopically. X-ray Survey and Spectroscopic identification We observed the field of SA 57 for 67 ks with XMM-Newton (Trevese et al 2007a). From co-added PN and MOS data we produced images in four energy bands and a sample of 140 objects was created. Optical identifications were performed by cross-correlating the X-ray sample with the photographic survey of SA 57 conducted at the Kitt Peak National Observatory, in the U, BJ, F, N bands during 15 years since 1974 (Koo 1986), containing 8146 objects in ~0.3 deg2 down to BJ~23, which constitutes the database of previous variability studies of SA 57 (Trevese et al. 1989, 1994, BTK). A spectroscopic campaign in the field of SA 57 was started during 2006 Optical image of SA57 with the and 140 X-ray sources 0.5-10 keV X-ray contours Global properties We extract the count rate in 3 bands: S (0.5-2 keV), M(2-4.5 keV) and H (4.5-10 keV) and compute HR1 (M-S/M+S) and HR2 (H-M/H+M). These give an indication on absorption and spectral shape. • X-ray Spectral Analysis • We extract the spectral counts in the 0.5-10 keV band for all the140 detected sources from circular regions of radii in the range10-15’’. • 53 sources (38%) have a number of total net counts > 100. For these we performed spectral fit with χ2 minimization method. • 66 sources (47%) have a number of net counts < 100 and > 40. For these sources we used the C-statistic minimization method (Cash 1979) that do not require the binning of spectral counts. • 19 sources (13%) have a number of net counts < 40. For these sources we computed the HR (defined H2-S/H2+S, taking H2=H+M) in order to evaluate the NH at least. • The X-ray spectral analysis have been performed with XSPEC v.12.3.1 • For sources without redshift, we adopted z = 1 which is close to the <z> value. • 2 sources are identified as stars and were therefore excluded from the sample. • X-ray Spectral Results • For 126 sources the best fit model is an absorbed power-law. • Values of Γ are in the range 1.2 < Γ < 3.5, and values of column density NH are in the range 20 < Log(NH) < 24.3. • The 2-10 keV band fluxes are in the range • 2.5x10⁻¹⁵ < F2-10keV < 6x10-14 erg cm-2 s-1 . • 8 sources show a thermal spectrum and have been fitted with a mekal model (see Liedhal, Osterheld and Goldstein 1995). • Temperatures of the emitting gas are in the range • 0.3 < KT < 2.3 keV. • All these sources are optically identified as Galaxies, or are unidentified. Distribution of HR1 vs HR2 for all the 140 detected sources. Squares: type-1 AGNs; triangles: type-2 AGN; diamonds: Galaxies or XBONGS. Small points: unidentified sources; Circles: variability selected sources. Dashed lines show the expected HR for a simulated spectrum of increasing NH (crosses left to right: 1020 1022 1023 1024 cm-2) and decreasing Γ (top to left: 3, 1.9, 0.5) at z=1. Distribution of NH in the sample of sources with absorbed power-law spectrum . Dashed histogram represents sources with an upper limit in the NH value. Left Panel: distribution of NH vs H band Flux for the sample of power-law spectrum sources. Symbols as in the previous figure. Right Panel: distribution of NH as a function of the 2-10 keV band unabsorbed Luminosity for sources with redshift. Left Panel: distribution of Γ as a function of the 2-10 keV band Flux. Symbols as in previous figure. Right Panel: Histogram of Γ for the same sources. Fraction of X-ray obscured sources (NH>1022 cm-2) as a function of 2-10 keV band Flux for theSA57 survey (black circles), compared with others X-ray surveys: Red triangles, CDF-S (Tozzi et al. 2006 ); blue triangles, CDF-N (Barger et al. 2005); cyan cross, XMM-Lockman Hole (Mainieri et al. 2002); green pentagon, ASCA Large Area Survey (Akiyama et al. 2000); violet squares, Piconcelli et al.(2003) sample; yellow square, Piccinotti et al. (1982) sample. Dashed line represents model prediction from Gilli et al. 2007 model (thanks to R. Gilli for model and data points). • Peculiar sources • Source SA57X120 has been selected for variability in BTK. • The optical spectrum of this source, published in Trevese et al. 2008, show Narrow lines of [OII] and [OIII] and no evidence of Broad lines, and has been therefore classified as a type-2 AGN. • The x-ray spectrum instead shows no evidence of absorption (NH<0.07x1022 cm-2). • This behavior could have different interpretation: • The source could be intrinsically lacking of Broad Line Region. • The Broad lines could be present but undetected in the optical spectrum because of the contribution of the surrounding galaxy. • The source could have a variable absorber that has changed its column density from one observation to the other. • This is the brightest source in the X-ray sample ( FX = 6x10-14 erg cm-2 • s-1) and is the only one showing an emission line of Fe Kα with significance > 98%. • We separated the exposure in 2 parts of ~30 ks, to check for Fe K α variability, finding no significant evidence. SA57X120 NSER14264 z=0.286 This is an extended variable candidate also detected in X-rays. Spectroscopically confirmed AGN. ze=0.286 based on [OII]3727Å, [OIII]4959Å and 5007Å. za=0.287 based on CaII K and H. Approximate agreement with previous determination by BTK (z=0.287). The X-ray spectrum is fitted by a power-law with a photon index 1.88 plus a narrow Fe line with EW=586 eV. • Conclusions • The NH distribution of the X-ray survey is consistent with that obtained from other surveys of comparable Flux limit (HELLAS2XMM 1df, Perola et al. 2004; XMM-Lockman Hole, Mateos et al. 2005, COSMOS, Mainieri et al. 2007). • The fraction of obscured (NH>1022 cm-2) sources as a function of 2-10 keV Flux follow the shape obtained in surveys of similar Flux limit and that predicted from synthesis model (e.g. Gilli et al. 2006). • The X-ray emission of SA57X120 show no evidence of absorption, while the optical spectrum is typical of type-2 AGN. We proposed 3 possible explanation to this decoupling in the optical and X-ray classification. • SA57X91 has an X-ray spectrum showing a double thermal component. The higher temperature T=2.30 keV is consistent with intra group gas emission, suggesting this source is in the center of a group of galaxies. • We are performing further optical spectroscopy in order to increase the fraction of identified sources. Bibliography Akiiyama, M., Ohta, K., Yamada, T. et al. 2000, ApJ, 532, 700 Barger, A. J., Cowie, L. L., Mushotzky, R. F., et al. 2005 AJ, 129, 578 Bershady, M. A., Trevese, D., & Kron, R. G. 1998, ApJ, 496, 103 (BTK) Cash, W.,ApJ, 228, 939 Gilli, R., Comastri, A., Hasinger, G. 2007, A&A, 463, 79 Koo, D.C., 1986, ApJ, 311, 651 Koo, D. C., Kron, R. G., & Cudworth, K. M. 1986, PASP, 98, 285 Infante, L., Pritchet, C. J., & Hertling, G., 1995, J. Astron. Data, 1, 2 La Franca, F., Fiore, F., Comastri, A. et al., 2005, ApJ, 635, 864 Mainieri, V., Bergeron, J., Hasinger, G., et al. 2002, A&A , 303, 425 Mainieri, V., Hasinger, G., Cappellutti, N., et al. 2007, ApJS, 172, 368 Mateos, S., Barcons, X., Carrera, F. J., et al. 2005, A&A, 444, 79 Munn, J. A., Koo, D. C., Kron, R. G., Majewski, S. R., Bershady, M. A., Smetanka, J. J., 1997, ApJS, 109, 45 Perola, G. C., Puccetti, S., Fiore, F., et al. 2004, A&A, 421, 491 Piccinotti, G., Mushotzky, R. F., Boldt, E., et al. 1982, ApJ, 253, 485 Piconcellim, E., Cappi, M., Bassani, L., et al. 2003, A&A, 412, 689 Tozzi, P., Gilli. R., Mainieri, V., et al. 2006, A&A, 451, 457 Trevese, D., Pittella G., Kron R. G.,Koo D. C., & Bershady M. A. 1989, AJ, 98, 108 Trevese, D., Kron, R. G., Majewski, S. R., Bershady, M. A., Koo, D. C. 1994, ApJ, 433, 494 Trevese, D. , Vagnetti, F., Puccetti, S., Fiore, F., Tomei, M., Bershady, M. A. 2007a, A&A , 469,1211 Trevese, D., Zitelli, V., Vagnetti, F., Boutsia, K., Stirpe, G.M. 2008, A&A , 477,473 Ueda, Y., Akiyama, M., Ohta, K., Miyaji, T. 2003, ApJ 598, 886 Wolf, C., Wisotzki, L., Borch, A., et al., 2003, A&A, 408, 499 SA57X91 NSER11014 z=0.125 This spectrum is fitted by a combination of two thermal bremstrahlungs with temperatures T1=0.75 keV and T2=2.30 keV. The presence of some nearby galaxies with nearly the same redshift suggests this source is a galaxy inside a group or cluster. The X-ray Universe 2008. Granada, Spain 27-30 May 2008 Active Galactic Nuclei 8. Torino 19-22 May 2008