Download
1 / 41
410 likes | 506 Views
Climate Modelling and eScience. Dave Frame Climate Dynamics Group, Department of Physics, University of Oxford. climate prediction .net. The Goals: To harness the power of idle PCs to help quantify uncertainty in predictions of the 21st century climate.

E N D
Climate Modelling and eScience Dave Frame Climate Dynamics Group, Department of Physics, University of Oxford
climateprediction.net • The Goals: • To harness the power of idle PCs to help quantify uncertainty in predictions of the 21st century climate. • To improve public understanding of the nature of uncertainty in climate prediction. • The Method: • Invite the public to download a full resolution, 3D climate model and run it locally on their PC. • Use each PC to run a single member of a massive, perturbed physics ensemble. • Provide visualization software and educational packages to maintain interest and facilitate school and undergraduate projects etc.
1950 2000 2050 Forecast Hindcast Experiments 2 (hindcast) and 3 (forecast)
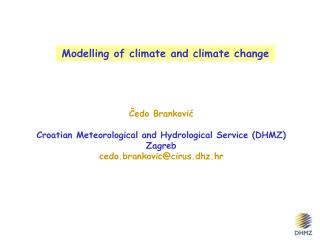
Sources of Uncertainty Basic sources of uncertainty in climate forecasts: • Incomplete knowledge of the initial state of the system • Uncertainty in future forcings • Uncertain models – poor/incomplete representation of the physical processes that govern the climate The climateprediction.net approach to forecast uncertainty • climateprediction.net targets uncertainty in the initial state of the atmosphere by running the same model several (~10) times with different initial states (initial condition ensembles) • climateprediction.net targets uncertainty in future forcings by running many different solar, sulphate and greenhouse scenarios (forcing ensembles) • climateprediction.net targets model uncertainty by altering the model’s physics (perturbed physics ensembles) To systematically explore model uncertainty requires large numbers of simulations, due to the non-linear interaction of parameters. Hence the need for climateprediction.net to carry out such an ensemble.
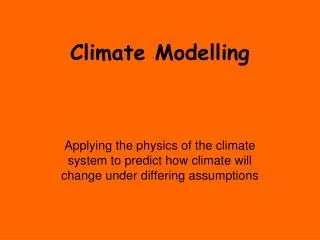
Climate Model Resolution GCM resolution ~ 2.5° in lat,lon Sub-grid scale processes need to be parameterized – it’s not easy to do this The Met Office
Initial Results: Climate Sensitivity Frequency Distribution Courtesy David Stainforth
Results so far • Initial analysis shows that the model runs fine on a 32bit PC (Windows, Linux, Mac). • Analysis of duplicate runs and initial condition ensembles validates experimental integrity • Analysis of subset of the ensemble shows that changes in model physics add, generally, non-linearly, necessitating the large ensemble approach • Analysis of ensemble against observations shows we can’t rule out high sensitivity (10K) models
Status and Plans • Publicly available: • ~40,000 simulations complete. • 3,000,000+ years simulated. • 65,000+ registered participants • Now available in Linux, Mac, as well as Windows • Continuing to develop educational materials • Making sense of the data • Analyse the results!
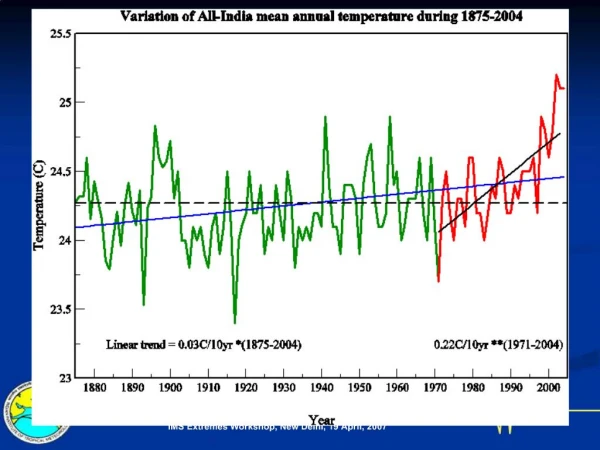
Initial Results: Global mean temperature 40,000 runs completed and returned to us largest climate model ensemble by a factor of over 800. The results of the CO2 doubling experiment let us access a wider range of climate sensitivities than has been possible before Analysis has illustrated the value and validity of the approach Courtesy David Stainforth
See the effects of a doubling of CO2 on your Earth-like planet (To be integrated with the data on the previous slide in order to give context for your run within the ensemble as a whole.)
View your model as it changes over hours, days, seasons and years
Maintaining Interest • Elementary visualisation package lets casual users explore their world • Web-server technology lets them learn more about how their world changes over time • Advanced visualisation package lets interested users investigate their world more thoroughly • Open University (UK) entry level course based on climateprediction.net currently under development – launching in February 2005 • Working with secondary school educators (UK, NZ) to develop resources for teachers to tie climateprediction.net into syllabus • WAP-phone technology to keep you posted about your run! • Very keen to develop further international links in education sector – very much an international project
Web development • Continuing to develop, extend and maintain the site • Ease of navigation, ease of access to information are high priorities • Make it more accessible for disabled users • Ring-fence some parts of the site: • Open University short course • UK schools • International schools..? • Develop useful scientific collaboration site (like CMIP, maybe like NOAA CDC) for research partners
A schematic history of climateprediction.net • Started with Met Office climate model which ran on 64-bit supercomputers
A schematic history of climateprediction.net • Started with Met Office climate model which ran on 64-bit supercomputers • Step 1: Port to 32-bit linux machines
A schematic history of climateprediction.net • Started with Met Office climate model which ran on 64-bit supercomputers • Step 1: Port to 32-bit linux machines • Step 2: Port to 32-bit MS Windows machines
A schematic history of climateprediction.net • Started with Met Office climate model which ran on 64-bit supercomputers • Step 1: Port to 32-bit linux machines • Step 2: Port to 32-bit MS Windows machines • Step 3: Develop cpdn client such that the model runs: • in the background • in parallel with other software • in a stable manner
A schematic history of climateprediction.net • Started with Met Office climate model which ran on 64-bit supercomputers • Step 1: Port to 32-bit linux machines • Step 2: Port to 32-bit MS Windows machines • Step 3: Develop a client such that the model runs reliably on a PC • Step 4: Add servers for download, upload of data, mindful of: • security • bandwidth • access
A schematic history of climateprediction.net • Started with Met Office climate model which ran on 64-bit supercomputers • Step 1: Port to 32-bit linux machines • Step 2: Port to 32-bit MS Windows machines • Step 3: Develop a client such that the model runs reliably on a PC • Step 4: Add servers for download, upload of data. • Step 5: Start to make sense of the data.
A conceptual picture • This process can (roughly) be modelled as building from the application outwards • We invested heavily in model development 1999-2001 • We invested heavily in client development 2002-2004 • We are now investing significantly more resources into the server side • We will need to invest more in data access and climate research as the experiment progresses
A conceptual picture • This process can (roughly) be modelled as building from the application outwards • We invested heavily in model development 1999-2001 • We invested heavily in client development 2002-2004 • We are now investing significantly more resources into the server side • We will need to invest more in data access and climate research as the experiment progresses
A conceptual picture • This process can (roughly) be modelled as building from the application outwards • We invested heavily in model development 1999-2001 • We invested heavily in client development 2002-2004 • We are now investing significantly more resources into the server side • We will need to invest more in data access and climate research as the experiment progresses
A conceptual picture • This process can (roughly) be modelled as building from the application outwards • We invested heavily in model development 1999-2001 • We invested heavily in client development 2002-2004 • We are now investing significantly more resources into the server side • We will need to invest more in data access and climate research as the experiment progresses
A conceptual picture - caveats • Not a strict progression – we’ve always had to have something under development on the www, client, server, and analysis sides of the project. • But we’ve fleshed them out gradually outwards from the central application, which is the climate model running on the PC. • Is this a good model? • Probably.
Integrating into BOINC • Gives us: • The benefit of their extensive expertise and experience • Improved, more flexible control software • More stable server-client software • Allows us to join the world’s largest and most advanced DC community • Fits well with our long-term plans
Plans for the next year • Launch BOINC client • Release Sulphur cycle experiment • Release coupled model experiment (1950-2000) • On-going development of www site • Improved access to data • Diagnostic subprojects
Plans beyond the next year • On-going development of www site • Use new technology to aid access to data • Release coupled model experiment (2000-2050) • Deepen core team analysis of data • Develop diagnostic subprojects with research partners • Utilise cpdn/BOINC infrastructure for other environmental modelling problems • Develop sister projects: • climateprediction.eu ? • climate@home ?? • paleoprediction.net ???
Analytictools Interpretivetools Accessing and making sense of data • Build a multi-layer structure that allows participants at different levels to access the data with appropriate analytic and interpretive tools: • core team research scientists • research partners • sub-project partners • undergraduate students • school pupils • casual surfers
Accessing and making sense of data • Build a multi-layer structure that allows participants at different levels to access the data with appropriate analytic and interpretive tools: • core team research scientists • research partners • sub-project partners • undergraduate students • school pupils • casual surfers Virtual Research Environment Virtual Learning Environment
Building a VRE/VLE is a challenge • There are plenty of eScience challenges in building such a multi-layer structure: • access, authentication, authorisation • security • analysis, visualisation tools • tools to aid interpretation • peer-to-peer tools to enable collaboration at both experimental and VLE level • Mostly on the server side (as we build the structure away from the core application)
VLE tools • OU Book chapters • Schools materials • Advanced visualisation tools • Other climateprediction.net pages • Prompt publication of our research results • Developing an interactive context for participants’ individual runs and those of others in various groups: • members of initial condition ensemble • neighbours in parameter space • neighbours in physical space
VRE tools • Robust quality control software • Secure, reliable data access to data (NDG) • State-of-the-art climate analysis software accessible through web/grid services • Documentation sufficient to enable scientists to know: • what data we have (resolution, stored fields, etc.) • what is already being done with it (& plans) • Software, middleware, publication, etc archives • Opportunities to collaborate/discuss issues within climateprediction.net VRE
Long term plans • Sister projects: • climateprediction.eu • climate@home • Great way to solve problems in: • Ensemble modelling • Environmental modelling • Opportunity for BOINC to play an important role in a burgeoning field within scientific problem solving
Some thoughts on the GRID & climate modelling • Shift of emphasis from focus on conserving processor time to making good use of data • Bandwidth still a constraint for foreseeable future • Will enable adequate treatment of initial condition error (very useful for seasonal, weather forecasting…)
Some thoughts on the grid • Inseparability of software engineering & applications tasks • Can’t all be done by requirements because of emergent constraints • Many grid projects from first round currently stuck in “we have this half and that half; we just need to combine them.” • Bandwidth still a constraint for most applications, in spite of hype to the contrary • Network upgrades different from computer upgrades • Difficulties when you go “off-trunk” • Need more “halfway-grid” projects like DC to explore the issues practically (or danger of widespread grid failure)
World coverage Challenge: To fill in the gaps, especially where the barrier is as simple as language.